VLFLfaceNormalplot
by Tim C. Lueth, SG-Lib Toolbox: SolidGeometry 5.6 - Visualization
Introduced first in SolidGeometry 4.1, Creation date: 2017-08-06, Last change: 2025-09-14
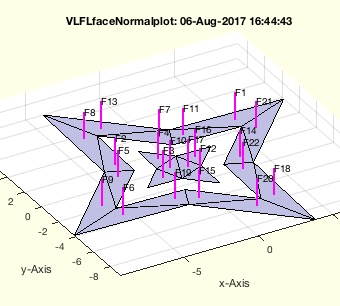
plots normal vector in appropriate length and writes the name of the facet at the tip
Description
plots only the normal vectors in appropriate length and writes the name of the facet at the tip. Use VLFLplot(VL,FL) to show the solid itself.
See Also: textT
, textP
, textVL
, textCVL
, textVLFL
Example Illustration
Syntax
h=VLFLfaceNormalplot(VL,FL,[c,t])
Input Parameter
VL: | | Vertex list |
FL: | | Facet List |
c: | | Color, default is magenta |
t: | | Thickness; default is 2 |
Output Parameter
h: | | handle to modify or delete text if necessary |
Examples
[VL,FL]=VLFLsample(13); SGfigure; view(-30,30); VLFLplot(VL,FL);
VLFLfaceNormalplot(VL,FL);
Copyright 2017-2025 Tim C. Lueth. All rights reserved. The code is the property of Tim C. Lueth and may not be redistributed or modified without explicit written permission. This software may be used free of charge for academic research and teaching purposes only. Commercial use, redistribution, modification, or reverse engineering is strictly prohibited. Access to source code is restricted and granted only under specific agreements. For licensing inquiries or commercial use, please contact: Tim C. Lueth
Algorithm (Workflow)
This function, VLFLfaceNormalplot, is designed to plot normal vectors of facets in a 3D model, with the option to label each facet at the tip of its normal vector. It is part of the SolidGeometry library and is used for visualization purposes.
Input Parameters
- VL: Vertex List - A matrix containing the coordinates of the vertices of the 3D model.
- FL: Facet List - A matrix defining the facets of the model using indices into the vertex list.
- c: Color - An optional parameter to specify the color of the normal vectors. The default color is magenta ('m').
- t: Thickness - An optional parameter to specify the thickness of the normal vectors. The default thickness is 2.
- sl: Scale Length - An optional parameter to adjust the length of the normal vectors. It defaults to one-tenth of the size of the bounding box of the vertex list.
Output Results
- h: Handle - A handle to the plotted objects, which can be used to modify or delete the text labels if necessary.
- FN: Face Normals - A matrix containing the normal vectors of each facet.
- IC: Incenter - A matrix containing the incenter of each facet, which is the point where the normal vector is plotted from.
Algorithm Steps
- Set default values for color (
c) and thickness (t) if they are not provided.
- Calculate the scale length (
sl) based on the size of the bounding box of the vertex list, unless a specific scale length is provided.
- Suppress warnings related to points not being in the triangulation.
- Create a triangulation object (
TRX) using the facet and vertex lists.
- Calculate the face normals (
FN) and incenters (IC) of the triangulation.
- For each facet, plot the normal vector from the incenter to the scaled normal vector endpoint using the specified color and thickness.
- Label the tip of each normal vector with the facet index.
Algorithm explaination created using ChatGPT on 2025-08-19 08:28. (Please note: No guarantee for the correctness of this explanation)
Last html export of this page out of FM database by TL: 2025-09-21