PSplot
by Tim C. Lueth, SG-Lib Toolbox: SolidGeometry 5.6 - Visualization
Introduced first in SolidGeometry 4.4, Creation date: 2018-12-29, Last change: 2025-09-14
plots a polyshape but also a cell list of polyshapes
Description
This function is required since currently the concept of polygon arrays and polyshape arrays seems to have less methods than the cell concept
isa(ps,'polyshape'), isa(ps,'polygon')
See Also: , PLplot
, CPLplotasPS
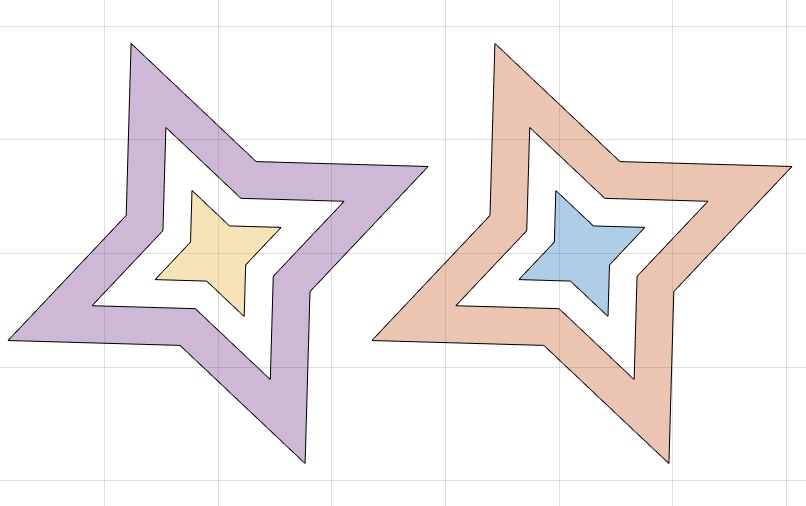
Example Illustration
Syntax
h=PSplot(ps,[])
Input Parameter
ps: | | polyshape or list of polyshapes |
Output Parameter
h: | | handle to plat, ie. polygons |
Examples
SGfigure; CPLplotasPS(CPLsample(14));
ps=PSofgca(true)
cla; PSplot(ps)
Copyright 2018-2025 Tim C. Lueth. All rights reserved. The code is the property of Tim C. Lueth and may not be redistributed or modified without explicit written permission. This software may be used free of charge for academic research and teaching purposes only. Commercial use, redistribution, modification, or reverse engineering is strictly prohibited. Access to source code is restricted and granted only under specific agreements. For licensing inquiries or commercial use, please contact: Tim C. Lueth
Algorithm (Workflow)
This function, PSplot, is designed to plot polyshapes or a list of polyshapes. It is part of the SolidGeometry library and was introduced to address limitations in handling polygon and polyshape arrays in MATLAB.
Input Parameters
- ps: This can be a single polyshape or a list (cell array) of polyshapes.
- varargin: This represents additional optional parameters that can be passed to the plot function.
Output Results
- h: A handle to the plot, which represents the plotted polyshapes.
Algorithm Steps
- The function first checks if the input
ps is a cell array using iscell(ps).
- If
ps is not a cell array, it directly plots the polyshape using the plot function with any additional arguments provided in varargin.
- If
ps is a cell array, it converts the cell array to a class using cell2class(ps) and then plots it using the plot function with any additional arguments provided in varargin.
Example Usage
The example provided in the comments demonstrates how to use the function:
SGfigure; CPLplotasPS(CPLsample(14));
ps=PSofgca(true)
cla; PSplot(ps)
This example shows how to create a figure, plot a sample polyshape, retrieve the polyshape from the current axes, and then clear the axes and plot the polyshape using PSplot.
Algorithm explaination created using ChatGPT on 2025-08-18 23:47. (Please note: No guarantee for the correctness of this explanation)
Last html export of this page out of FM database by TL: 2025-09-21