CPLplot
by Tim C. Lueth, SG-Lib Toolbox: SolidGeometry 5.6 - Visualization
Introduced first in SolidGeometry 1.3, Creation date: 2014-11-19, Last change: 2025-09-14
plots a 2D polybool contour polygon in a 3D figure
Description
Use CVLplot to plot open contours
use CVLplot to create individually colored contours
CPL is a nx2 point list with x/y coordinates related to the polybool convention used in to mapping toolbox
See Also: CPLanimateTL
, CPLplotasPS
, CPLfaceplot
, CPLplotregions
, CPLplotcolors
, CPLplotinout
, CVLplot
, CPLplotcwccw
Example Illustration
Syntax
h=CPLplot(CPL,[c,w,t,b,f])
Input Parameter
CPL: | | Point list of x/y coordinates nx2 |
c: | | Color and symbol of points |
w: | | Width of the used line |
t: | | Size of a cone shaped arrow tip, default is 0 |
b: | | Size of a cube showing the start point of a contour; default is 0 |
f: | | Size of a ring showing the end point of a contour; default is 0 |
Output Parameter
Examples
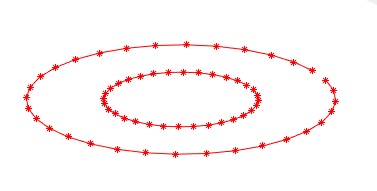
CPLplot([PLcircle(5);nan nan; PLcircle(3)],'r-'); shg
CVLplot([PLcircle(5);nan nan; PLcircle(3)],'-'); shg
Copyright 2014-2025 Tim C. Lueth. All rights reserved. The code is the property of Tim C. Lueth and may not be redistributed or modified without explicit written permission. This software may be used free of charge for academic research and teaching purposes only. Commercial use, redistribution, modification, or reverse engineering is strictly prohibited. Access to source code is restricted and granted only under specific agreements. For licensing inquiries or commercial use, please contact: Tim C. Lueth
Last html export of this page out of FM database by TL: 2025-09-21