by Tim C. Lueth, SG-Lib Toolbox: SolidGeometry 5.6 - CPL/Closed Polygon Lists
Introduced first in SolidGeometry 4.3, Creation date: 2018-10-18, Last change: 2025-09-14
See Also: CPLplotasPS
, CPLplot
, CPLfaceplot
, CPLplotregions
, CPLplotinout
, CPLplotcwccw
h=CPLplotcolors(CPL,[ind,fs])
CPL: | Closed Polygon line | |
ind: | indizes; default is all | |
fs: | optional font size |
h: | handle to graphics objects |
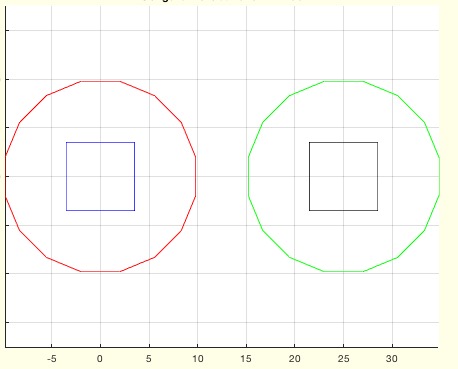
SGfigure; CPLplotcolors(CPLsample(12));
SGfigure; CPLplotcolors(CPLsample(12),'',16);
This function, CPLplotcolors, is designed to plot closed polygon lines (CPL) with different colors. It is part of the SolidGeometry library and was introduced in version 4.3. The function takes in a CPL and optional parameters to customize the plot.
h to store graphics handles.fs from the input parameters, defaulting to an empty array if not provided.cl from the input parameters, defaulting to 'r-' (red line) if not provided.ind of the polygons to plot. If not specified, use all polygons by default.ind:ci for the current polygon using the colofn function, cycling through a predefined set of colors ('rbgkcmy').ci2 for text annotations.ti to 1.CPLi using the selectNaN function.CPLisccw. If not, append a dot to the color ci; otherwise, increment ti.CPLplot and store the handle in h.fs is specified, add a text annotation to the plot using textVL, labeling the polygon with its index.The function is designed to provide a visual representation of closed polygon lines with customizable colors and optional text annotations, making it useful for graphical analysis and presentations.
Algorithm explaination created using ChatGPT on 2025-08-19 01:03. (Please note: No guarantee for the correctness of this explanation)