by Tim C. Lueth, SG-Lib Toolbox: SolidGeometry 5.6 - CPL/Closed Polygon Lists
Introduced first in SolidGeometry 4.3, Creation date: 2018-10-18, Last change: 2025-09-14
See Also: CPLplotasPS
, CPLplot
, CPLfaceplot
, CPLplotcolors
, CPLplotinout
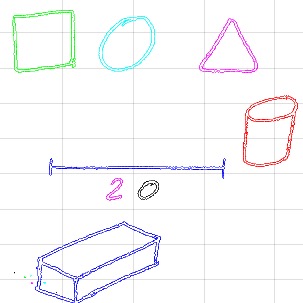
h=CPLplotregions(CPL,[ind])
CPL: | Closed polygon | |
ind: | index of regions; default is all |
h: | handle to graphics objects |
SGfigure; CPLplotregions(CPLsample(14))This function, CPLplotregions, is designed to plot regions of a closed polygon list (CPL) using different colors. It is part of the SolidGeometry library and was introduced in version 4.3.
getfuncparams to determine the simplification parameter for the polygon. This function checks the input arguments and returns a boolean indicating whether to simplify the polygon.polyshape object is created from the CPL using the simplification parameter. This object represents the geometric shape of the polygon.regions function is called on the polyshape object to obtain the individual regions of the polygon.getfuncparams function is called again to determine the indices of the regions to be plotted. If no specific indices are provided, it defaults to all regions.h is initialized to store the handles to the graphics objects.separateNaN is called on the CPL, which likely separates the polygon into distinct parts if there are NaN values indicating breaks.CPLplot function is called with the vertices of the region and a color determined by colofn. The color is selected from a predefined set ('rbgkcym') and a default ('r-').CPLplot is appended to the array h.The function concludes by returning the array h, which contains the handles to the plotted regions.