CPLfaceplot
by Tim C. Lueth, SG-Lib Toolbox: SolidGeometry 5.6 - CPL/Closed Polygon Lists
Introduced first in SolidGeometry 3.4, Creation date: 2017-02-08, Last change: 2025-09-14
plots the faces of a CPL
Description
In contrast to CPLplotasPS, this function is not using the polyshape concept but the delaunay concept
See Also: CPLplotasPS
, CPLplot
, CPLplotregions
, CPLplotcolors
, CPLplotinout
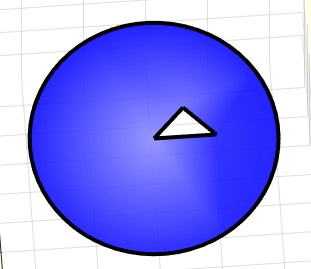
Example Illustration
Syntax
h=CPLfaceplot(PL,[c,w,a])
Input Parameter
PL: | | Point List or CPL |
c: | | color |
w: | | countour width |
a: | | alpha; default is 0.5 |
Output Parameter
Examples
SGfigure;
CPLfaceplot([PLcircle(20);NaN NaN; [0 0; 10 0; 5 5]],'b',0.1)
Copyright 2017-2025 Tim C. Lueth. All rights reserved. The code is the property of Tim C. Lueth and may not be redistributed or modified without explicit written permission. This software may be used free of charge for academic research and teaching purposes only. Commercial use, redistribution, modification, or reverse engineering is strictly prohibited. Access to source code is restricted and granted only under specific agreements. For licensing inquiries or commercial use, please contact: Tim C. Lueth
Algorithm (Workflow)
This function, CPLfaceplot, is designed to plot the faces of a Closed Polygon List (CPL) using the Delaunay triangulation concept. Below is a detailed explanation of the algorithm and its parameters:
Input Parameters
- PL: This is the Point List or Closed Polygon List (CPL) that defines the vertices of the polygon to be plotted.
- c: This parameter specifies the color of the plot. It defaults to 'r' (red) if not provided.
- w: This parameter defines the contour width of the plot. It defaults to 1 if not provided.
- a: This parameter sets the alpha transparency of the plot, with a default value of 0.5.
Output
- h: This is the handle to the plot, which can be used for further manipulation or querying of the plot properties.
Algorithm Steps
- The function first checks if the input
PL is empty. If it is, the function returns an empty handle h and exits.
- It then assigns default values to the parameters
c, w, and a if they are not provided in the function call.
- The function converts the Point List
PL into a Closed Polygon List CPL using the function CPLofPL.
- If the contour width
w is greater than 0, the function calls CPLplot to plot the outline of the CPL with the specified color and width.
- If the alpha value
a is greater than 0, the function performs the following steps:
- It uses
PLFLofCPLdelaunay to obtain the Point List PL and Face List FL from the CPL using Delaunay triangulation.
- The function then calls
VLFLplot to plot the vertices and faces with the specified color.
- It sets the transparency of the plot using
alpha(h,a), and applies flat lighting and shading to the plot.
Algorithm explaination created using ChatGPT on 2025-08-19 01:37. (Please note: No guarantee for the correctness of this explanation)
Last html export of this page out of FM database by TL: 2025-09-21