CPLplotinout
by Tim C. Lueth, SG-Lib Toolbox: SolidGeometry 5.6 - CPL/Closed Polygon Lists
Introduced first in SolidGeometry 4.4, Creation date: 2018-12-23, Last change: 2025-09-14
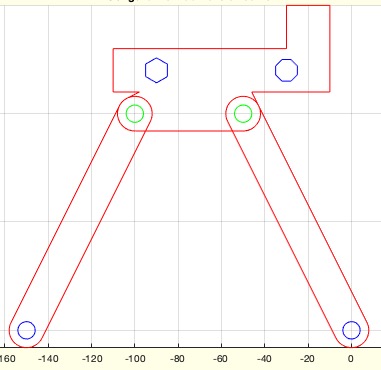
plots the CPLs in colors depending in the enclosure level
Description
plots the enclosing level using the colorstring 'rbgymcwk'
See Also: CPLplot
, CPLplotcolors
, CPLplotregions
, CPLplotcwccw
Example Illustration
Syntax
h=CPLplotinout(CPL,[col])
Input Parameter
CPL: | | Closed Polygon line |
col: | | line type; first char (color) is ignored |
Output Parameter
Examples
SGfigure; CPLplotinout(CPLsample(14))
SGfigure; CPLplotinout(CPLsample(14),'?-.')
SGfigure; CPLplotinout(CPLsample(14),'?-.',4)
Copyright 2018-2025 Tim C. Lueth. All rights reserved. The code is the property of Tim C. Lueth and may not be redistributed or modified without explicit written permission. This software may be used free of charge for academic research and teaching purposes only. Commercial use, redistribution, modification, or reverse engineering is strictly prohibited. Access to source code is restricted and granted only under specific agreements. For licensing inquiries or commercial use, please contact: Tim C. Lueth
Algorithm (Workflow)
This function, CPLplotinout, is designed to plot closed polygon lines (CPLs) with colors that depend on the enclosure level. It is part of the SolidGeometry library and was introduced in version 4.4.
Input Parameters
- CPL: This is the main input, representing the closed polygon line that needs to be plotted.
- col: This is an optional parameter that specifies the line type. The first character, which represents the color, is ignored in this function.
Output
- h: This is the handle to the plot that is generated by the function.
Algorithm Steps
- The function begins by determining the color and line type using the
getfuncparams function. If no specific line type is provided, it defaults to 'r-'.
- Additional parameters are extracted from
varargin starting from the second element onward.
- The function
CPLsortinout is called with the CPL input to determine the enclosure levels of the polygons.
- An array
h is initialized to store plot handles, with its size based on the number of elements in the sorted enclosure levels.
- A loop iterates over each element in the sorted enclosure levels:
- For each element, the function
colofn is used to determine the color based on the enclosure level, using the color string 'rbgymcwk'.
- The function
CPLplot is called to plot the polygon, using the separateNaN function to handle NaN values, and the determined color and additional parameters.
- The handle of the plot is stored in the array
h.
The function is designed to work with other related functions such as CPLplot, CPLplotcolors, CPLplotregions, and CPLplotcwccw, which provide additional plotting capabilities for closed polygon lines.
Algorithm explaination created using ChatGPT on 2025-08-19 00:07. (Please note: No guarantee for the correctness of this explanation)
Last html export of this page out of FM database by TL: 2025-09-21