CVLplot
by Tim C. Lueth, SG-Lib Toolbox: SolidGeometry 5.6 - Visualization
Introduced first in SolidGeometry 3.2, Creation date: 2016-12-26, Last change: 2025-09-14
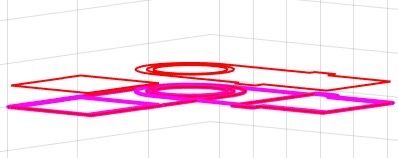
plots a 2D polybool contour polygon in a 3D figure
Description
CVL is a nx3 point list with x/y/z coordinates separated by NaN NaN NaN
the function replaces the colors by the standard colors to show the separated contours
See Also: VLFLcoatPCVL
, TofPCVL
, VLplot
, PLplot
, CVLplots
Example Illustration
Syntax
h=CVLplot(CVL,[c,w])
Input Parameter
CVL: | | Point list of x/y coordinates nx2 |
c: | | Color and symbol of points |
w: | | Width of the used line |
Output Parameter
Copyright 2016-2025 Tim C. Lueth. All rights reserved. The code is the property of Tim C. Lueth and may not be redistributed or modified without explicit written permission. This software may be used free of charge for academic research and teaching purposes only. Commercial use, redistribution, modification, or reverse engineering is strictly prohibited. Access to source code is restricted and granted only under specific agreements. For licensing inquiries or commercial use, please contact: Tim C. Lueth
Algorithm (Workflow)
This algorithm is a MATLAB function named CVLplot that visualizes 2D contour polygons in a 3D figure. It is part of the SolidGeometry library and was developed by Tim Lueth. The function takes a list of points and plots them with specified colors and line widths.
Input Parameters
- CVL: A point list of x/y coordinates in an nx2 matrix format. If the list is empty, the function returns an empty handle.
- c: A string specifying the color and symbol of the points. This is an optional parameter.
- w: A numeric value specifying the width of the line used in plotting. This is also an optional parameter.
Output
- h: A handle to the figure created by the plot.
Algorithm Steps
- Initialize a color map
cmap with the string 'kbgcrmy', representing different colors.
- Check if
CVL is empty. If it is, return an empty handle.
- If
CVL is a cell array, convert it into a single matrix NCVL by concatenating its elements, separated by NaN NaN NaN.
- Determine the number of separate contours in
CVL using the function separateNaN.
- Initialize an empty array
h to store figure handles.
- Loop through each contour:
- Extract the i-th contour using
separateNaN(CVL, i).
- Check if additional arguments are provided. If not, set default plot options
locvar to {'r*-'}.
- If the color parameter
c is not provided or is empty, replace default colors in locvar with a color from cmap based on the contour index.
- Plot the contour using
VLplot with the specified options and append the handle to h.
- Use
hold on to ensure all contours are plotted on the same figure.
Algorithm explaination created using ChatGPT on 2025-08-19 07:29. (Please note: No guarantee for the correctness of this explanation)
Last html export of this page out of FM database by TL: 2025-09-21