CVLplots
by Tim C. Lueth, SG-Lib Toolbox: SolidGeometry 5.6 - Visualization
Introduced first in SolidGeometry 4.1, Creation date: 2017-08-28, Last change: 2025-09-14
similar to CVLplot but shows optionally the direction of the line segments
Description
This procedure is different to VLELplot
See Also: VLELplots
, CPLplot
, PLplot
, VLplot
, CVLplot
Example Illustration
Syntax
h=CVLplots(CVL,[c,w,t,b,f])
Input Parameter
CVL: | | Several closed vertex list separated by nan |
c: | | Optional color of desired edges; default changing colors |
w: | | Optional line width; default is 1 |
t: | | Size of a cone shaped arrow tip, default is ''=invisible |
b: | | Size of a cube showing the start point; default is ''=invisible |
f: | | Size of a ring showing the end point; default is ''=invisible |
Output Parameter
h: | | handle to drawing elements |
Examples
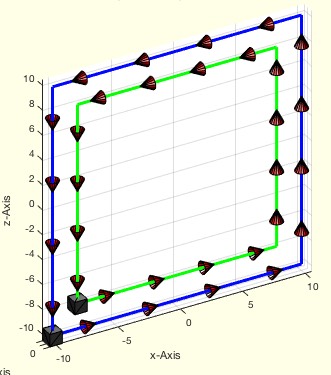
SGfigure; view(-30,30); CVLplots(VLsample(18),'',3,1);
SGfigure; view(-30,30); CVLplots(VLsample(18),'',3,1,1);
SGfigure; view(-30,30); CVLplots(VLsample(18),'',3,1,1,1);
Copyright 2017-2025 Tim C. Lueth. All rights reserved. The code is the property of Tim C. Lueth and may not be redistributed or modified without explicit written permission. This software may be used free of charge for academic research and teaching purposes only. Commercial use, redistribution, modification, or reverse engineering is strictly prohibited. Access to source code is restricted and granted only under specific agreements. For licensing inquiries or commercial use, please contact: Tim C. Lueth
Last html export of this page out of FM database by TL: 2025-09-21