VLplot
by Tim C. Lueth, SG-Lib Toolbox: SolidGeometry 5.6 - Visualization
Introduced first in SolidGeometry 1.0, Creation date: 2012-04-07, Last change: 2025-09-14
Plots different views of a vertex list (nx3) as contour lines or individual points.
Description
This function is used very often and is based on plot3 or lplot.
See Also: VLplot
, VLscatter
, textVL
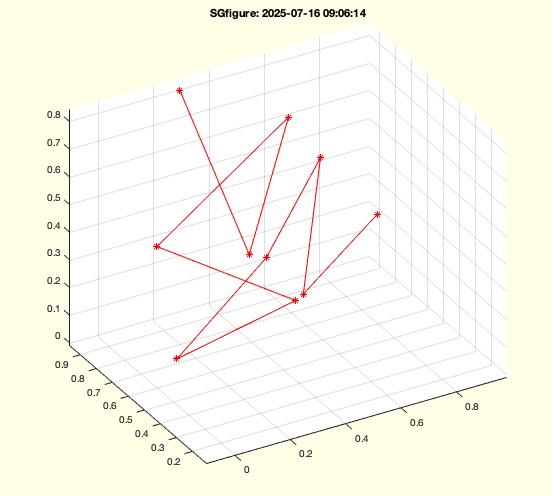
Example Illustration
Syntax
h=VLplot(VL,[c,w,vec])
Input Parameter
VL: | | Vertex list |
c: | | optional color; default is 'r.-' |
w: | | plot size |
vec: | | if v>0, vectors are plotted from the origin |
Output Parameter
Examples
VL=rand(10,3);
SGfigure(-30,30); VLplot(VL)
Copyright 2012-2025 Tim C. Lueth. All rights reserved. The code is the property of Tim C. Lueth and may not be redistributed or modified without explicit written permission. This software may be used free of charge for academic research and teaching purposes only. Commercial use, redistribution, modification, or reverse engineering is strictly prohibited. Access to source code is restricted and granted only under specific agreements. For licensing inquiries or commercial use, please contact: Tim C. Lueth
Algorithm (Workflow)
This function, VLplot, is used to plot different views of a vertex list as contour lines or individual points. It is based on plot3 or lplot.
Input Parameters
- VL: Vertex list, a matrix with dimensions n x 3.
- c: Optional color, default is 'r.-'.
- w: Plot size, default is 1.
- vec: If greater than 0, vectors are plotted from the origin, default is 0.
Output
Algorithm Steps
- Initialize
h as an empty array.
- If
VL is a cell array, iterate over each element and call VLplot recursively.
- If
VL has no rows, return immediately to prevent errors.
- If
VL has fewer than 3 columns, add a zero column using VLaddz.
- Use
separateNaN to handle NaN values in VL. If more than one segment is found, iterate over each segment and call VLplot recursively.
- Set default values for
c, w, and vec if they are not provided in varargin.
- If
vec is 0, plot the vertex list using plot3 with the specified color and line width.
- If
vec is greater than 0, iterate over each row in VL and plot vectors from the origin using lplot.
Algorithm explaination created using ChatGPT on 2025-08-19 07:20. (Please note: No guarantee for the correctness of this explanation)
Last html export of this page out of FM database by TL: 2025-09-21