by Tim C. Lueth, SG-Lib Toolbox: SolidGeometry 5.6 - VM/Voxels
Introduced first in SolidGeometry 2.1, Creation date: 2015-01-22, Last change: 2025-09-14
h=VLscatter(VL,[C,n,cmap])
VL: | Vertex list | |
C: | Intensity List (Hounsfield) | |
n: | step size for vertex selection | |
cmap: | optional colormap; such as 'gray' |
h: | handle to plot |
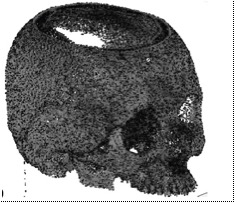
Scatter a Voxelmodel
VLscatter(VLofVM(V>1600),V(find(V>1600)),10);
This function, VLscatter, is designed to plot a vertex list with a corresponding image intensity list. It is part of the SG-Library and was introduced in SolidGeometry 2.1. The function is used to visualize voxel models by plotting vertices in 3D space with color intensities.
VL is a 3D matrix. If so, an error is raised, suggesting the use of VMscatter for 3D matrices.VL has only two columns, a z-coordinate is added using VLaddz.C from the input parameters. If not provided, a default intensity of 4096 is used for all vertices.n from the input parameters. If not provided, a default value of 1 is used.cmap from the input parameters. If provided, it is applied to the plot.scatter3 to plot the vertices in 3D space, using the specified step size n and color intensities C. The size of the markers is set to 20*n, and the markers are filled.The function is useful for visualizing voxel models by plotting a subset of vertices with color intensities, allowing for a clear representation of the data in 3D space.
Algorithm explaination created using ChatGPT on 2025-08-19 06:48. (Please note: No guarantee for the correctness of this explanation)