by Tim C. Lueth, SG-Lib Toolbox: SolidGeometry 5.6 - Visualization
Introduced first in SolidGeometry 4.2, Creation date: 2018-07-25, Last change: 2025-09-14
See Also: copyfig
subfig([p])
p: | position similar to subplot |
for i=1:4; SGfigure(SGbox([30,20,10])); view(-30,30);end
for i=1:4; SGfigure(SGbox([30,20,10])); view(-30,30); copyfig; end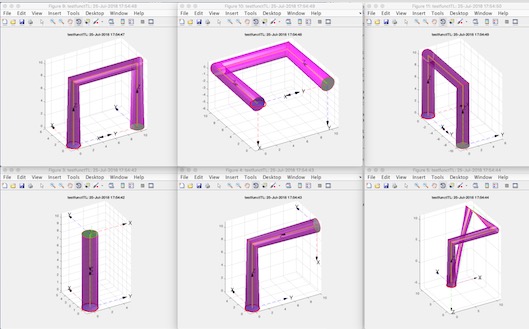
for i=1:4; SGfigure(SGbox([30,20,10])); view(-30,30); copyfig; subfig(i); endThis function, subfig, is designed to create subfigures on the screen similar to the subplot function in MATLAB. It is part of the SolidGeometry library and was introduced in version 4.2.
subplot. If not provided, it defaults to 1.delta with a value of 50. This is used to adjust the screen size and figure size.p. Otherwise, set p to 1.get(get(gcf,'Parent'),'ScreenSize') and adjust the width by subtracting delta.get(gcf,'Position') and get(gcf,'OuterPosition'), then adjust the height by subtracting delta.c and rows r that can fit on the screen by dividing the screen width and height by the figure's width and height, respectively.nmax that can fit on the screen as the product of r and c.mod1 function to adjust p within the range of nmax.dx and dy between figures.x and row y for the figure based on p.[sx, sy] for the figure on the screen.movegui(gcf,[sx sy]).show to update the display.