VLFLplots4
by Tim C. Lueth, SG-Lib Toolbox: SolidGeometry 5.6 - Visualization
Introduced first in SolidGeometry 1.0, Creation date: 2012-06-08, Last change: 2025-09-14
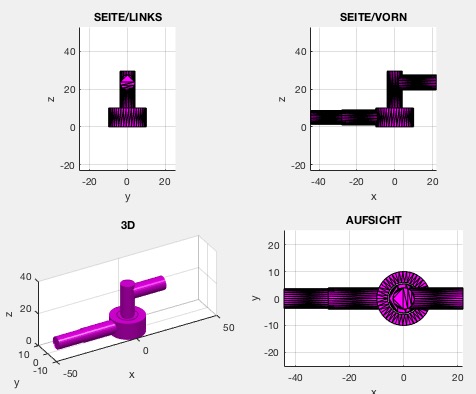
plots an object/solid as shaded or faceted object in 4 views
Description
much faster than VLFLplot4. Works with select3d
Example Illustration
Syntax
VLFLplots4(VL,FL,[c])
Input Parameter
VL: | | Vertex list |
FL: | | Facet list |
c: | | Color |
Examples
Plot a shaded solid in 4 views in red:
VLFLplots (VL,FL,'r');
VLFLplotlight;
Copyright 2012-2025 Tim C. Lueth. All rights reserved. The code is the property of Tim C. Lueth and may not be redistributed or modified without explicit written permission. This software may be used free of charge for academic research and teaching purposes only. Commercial use, redistribution, modification, or reverse engineering is strictly prohibited. Access to source code is restricted and granted only under specific agreements. For licensing inquiries or commercial use, please contact: Tim C. Lueth
Algorithm (Workflow)
This MATLAB function, VLFLplots4, is designed to plot a 3D object or solid in four different views using vertex and facet data. The function is part of the VLFL-Library and is optimized for speed compared to its predecessor, VLFLplot4.
Input Parameters
- VL: Vertex list, a matrix where each row represents the coordinates of a vertex in 3D space.
- FL: Facet list, a matrix where each row represents a facet by indexing into the vertex list.
- c: Color, an optional parameter that specifies the color of the plot. If not provided, it defaults to 'r-' (red).
Algorithm Steps
- Initialize the color variable
c to 'r-' unless a third argument is provided.
- Set the colormap using
VLcol and determine the color mapping using color(c).
- Set the color limits for the plot using
clim([0 7]).
- For each of the four subplots, perform the following:
- Use
subplot to create a 2x2 grid of plots.
- Set the labels for the x, y, and z axes and enable the grid.
- Title each subplot according to its view: SEITE/LINKS, SEITE/VORN, AUFSICHT, and 3D.
- Plot the 3D surface using
trisurf, which takes the facet list and vertex coordinates as input.
- Set the view angle using
view to achieve the desired perspective for each subplot.
- Ensure the axes are equal and auto-scaled.
- Call
VLFLplotlight to add lighting effects to the 3D plot.
The function effectively visualizes a 3D object from multiple perspectives, providing a comprehensive view of its structure.
Algorithm explaination created using ChatGPT on 2025-08-19 08:12. (Please note: No guarantee for the correctness of this explanation)
Last html export of this page out of FM database by TL: 2025-09-21