VLELplot
by Tim C. Lueth, SG-Lib Toolbox: SolidGeometry 5.6 - Visualization
Introduced first in SolidGeometry 1.0, Creation date: 2012-04-08, Last change: 2025-09-14
plots lines given as vertex list CVL and edge list CLL
Description
This procedure is useful for displaying sets of edges, when just pplot is not sufficient. It was used for debugging exp_2012_04_08.
See Also: VLELplots
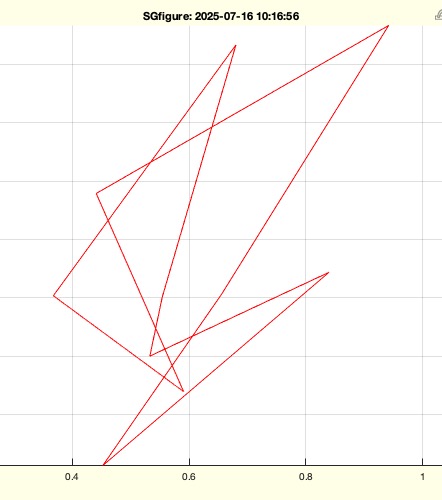
Example Illustration
Syntax
VLELplot(CVL,CEL,[c,NL,cn,VNL,cv])
Input Parameter
CVL: | | Vertex list |
CEL: | | Edge list |
c: | | Optional color of desired edges; default os 'r*-' |
NL: | | Optional edge normal vector list; default is [] |
cn: | | Optional color of normal vectors; default is 'b-' |
VNL: | | Optional vertex normal vector list; default is [] |
cv: | | Optional color of vertex normal vectors; default is 'm-' |
Examples
VL=rand(10,3), EL=ELofn(10)
SGfigure; VLELplot(VL,EL,'r-')
Copyright 2012-2025 Tim C. Lueth. All rights reserved. The code is the property of Tim C. Lueth and may not be redistributed or modified without explicit written permission. This software may be used free of charge for academic research and teaching purposes only. Commercial use, redistribution, modification, or reverse engineering is strictly prohibited. Access to source code is restricted and granted only under specific agreements. For licensing inquiries or commercial use, please contact: Tim C. Lueth
Algorithm (Workflow)
This function, VLELplot, is designed to plot lines defined by a vertex list and an edge list. It is particularly useful for visualizing sets of edges when simple plotting is insufficient. The function was originally used for debugging purposes.
Input Parameters
- CVL: Vertex list, a matrix where each row represents a vertex in 3D space.
- CEL: Edge list, a matrix where each row contains indices of two vertices that form an edge.
- c: (Optional) Color and style of the edges. Default is 'r*-'.
- NL: (Optional) Edge normal vector list. Default is an empty array [].
- cn: (Optional) Color and style of the normal vectors. Default is 'b-'.
- VNL: (Optional) Vertex normal vector list. Default is an empty array [].
- cv: (Optional) Color and style of the vertex normal vectors. Default is 'm-'.
Algorithm Steps
- Initialize default values for optional parameters if they are not provided.
- Determine the number of normal vectors (
nn) and vertex normal vectors (nv).
- Set up the plot with grid, equal axis scaling, and hold on for multiple plots.
- Iterate over each edge in the edge list (
CEL):
- Plot the edge using the vertices specified in
CVL and the color/style c.
- If edge normal vectors are provided (
nn > 0), calculate the midpoint of the edge and plot the normal vector from this midpoint using the color/style cn.
- If vertex normal vectors are provided (
nv > 0), plot the normal vector from the first vertex of the edge using the color/style cv.
Algorithm explaination created using ChatGPT on 2025-08-19 08:30. (Please note: No guarantee for the correctness of this explanation)
Last html export of this page out of FM database by TL: 2025-09-21