by Tim C. Lueth, SG-Lib Toolbox: SolidGeometry 5.6 - Visualization
Introduced first in SolidGeometry 5.0, Creation date: 2021-02-09, Last change: 2025-08-18
See Also: , axis4math
, axis4animation
, axisscale
, axis4all
ar=axisratio
ar: | [1 y/x z/x] |
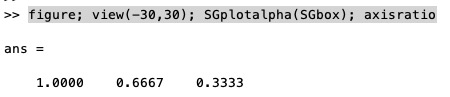
figure;
view(-30,30);
SGplotalpha(SGbox);
axisratio
This function, named axisratio, calculates the axis ratio of a plot in MATLAB. It is part of the SolidGeometry library and was introduced in version 5.0. The function does not take any input parameters and returns a vector ar as output.
The function does not require any input parameters.
The output ar is a vector that contains the axis ratios. Specifically, it returns a vector in the form [1, y/x, z/x], where y/x is the ratio of the y-axis length to the x-axis length, and z/x is the ratio of the z-axis length to the x-axis length if a third dimension is present.
axis command, which returns a vector ax containing the limits of the x, y, and possibly z axes.dx = ax(2) - ax(1).dy = ax(4) - ax(3).ar with the value [1, dy/dx], representing the ratio of the y-axis to the x-axis.ax contains more than four elements, it indicates the presence of a z-axis. The function then calculates the difference between the maximum and minimum z-axis limits, dz = ax(6) - ax(5).dz/dx to the output vector ar, resulting in [1, dy/dx, dz/dx].An example of how to use the function is provided in the comments:
figure; view(-30,30); SGplotalpha(SGbox); axisratio
This example creates a figure, sets the view, plots a box using the SGplotalpha function, and then calls axisratio to calculate and display the axis ratios.