by Tim C. Lueth, SG-Lib Toolbox: SolidGeometry 5.6 - Visualization
Introduced first in SolidGeometry 5.2, Creation date: 2022-03-31, Last change: 2025-08-18
See Also: copyfig
zoomsubplot
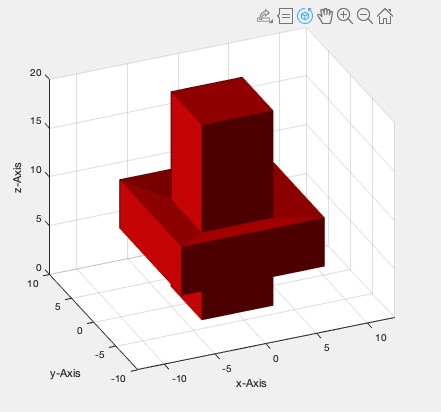
SGsample(3:12);   % Click into one subplot
zoomsubplotThis function, zoomsubplot, is designed to enhance the visualization of a subplot by opening it in a new figure window and enabling 3D rotation. Below is a detailed explanation of the algorithm and its parameters:
The function zoomsubplot does not take any input parameters directly. It operates on the current subplot selected by the user.
selectsubplot, which allows the user to select a subplot interactively. This function returns the handle to the selected subplot, stored in the variable ax.view function. These angles are stored in aw and ew respectively.SGofgca is called with the selected subplot handle ax to obtain the solid geometry data associated with the current axes. This data is stored in the variable SG.111. The cla function is called to clear the current axes in this new figure.SGTplotalpha is called with the solid geometry data SG to plot the geometry in the new figure.aw and ew using the view function.rotate3d on command is executed to enable interactive 3D rotation of the plot in the new figure.shg command is used to bring the new figure window to the front, making it visible to the user.The function does not return any output. It modifies the graphical display by opening a new figure window with the selected subplot, allowing for enhanced visualization and interaction.
Algorithm explaination created using ChatGPT on 2025-08-18 21:52. (Please note: No guarantee for the correctness of this explanation)