SGofgcfsubplots
by Tim C. Lueth, SG-Lib Toolbox: SolidGeometry 5.6 - Visualization
Introduced first in SolidGeometry 5.6, Creation date: 2025-09-08, Last change: 2025-09-15
takes the current gcf, collects all patches in the subplots and creates a cell list of solids/patches
Use carefully: The 'SGofgcfsubplots' function has not yet been extensively tested
Description
if nargout==0; the solids are plotted using SGplotcell
See Also: SGofgca
, VLFLofgca
, VLofgca
, PSofgca
, SGplotmultiple
, SGofgca2subplots
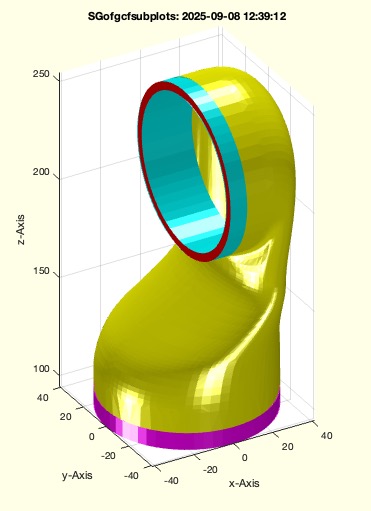
Example Illustration
Syntax
SG=SGofgcfsubplots([ind])
Input Parameter
ind: | | indices of the axis that should be considered |
Output Parameter
SG: | | cell array of solids in all subplots |
Examples
loadweb JACO_robot.mat; SGsurfaces(JC1);
SGofgca2subplots
SGofgcfsubplots
Copyright 2025 Tim C. Lueth. All rights reserved. The code is the property of Tim C. Lueth and may not be redistributed or modified without explicit written permission. This software may be used free of charge for academic research and teaching purposes only. Commercial use, redistribution, modification, or reverse engineering is strictly prohibited. Access to source code is restricted and granted only under specific agreements. For licensing inquiries or commercial use, please contact: Tim C. Lueth
Algorithm (Workflow)
This function, SGofgca2subplots, is designed to extract and organize graphical objects from a specified axis in MATLAB, specifically focusing on solids and patches. It is part of the SolidGeometry library and is used for visualization purposes.
Input Parameters
- hgca: This parameter represents the axis from which the function will extract graphical objects. If not provided, the default is the current axis,
gca.
Output Results
- SG: A cell array containing the extracted solids. Each cell contains a structure with fields for vertices, faces, and face vertex color data.
- l: An array of patches found within the specified axis.
Algorithm Steps
- The function begins by determining the axis to use, defaulting to
gca if no specific axis is provided.
- It checks if the specified axis is a valid graphics object of type 'Axes'. If so, it retrieves the children of this axis; otherwise, it uses the provided axis directly.
- The function identifies which of these children are patches using the
ispatch function.
- The number of patches,
np, is determined, and a cell array SG is initialized to store the solid data.
- For each patch, the function extracts the vertices, faces, and face vertex color data, storing them in a structure
SGi, which is then added to the SG cell array.
- If no output arguments are specified, the function calls
SGplotmultiple to plot the solids and enables 3D rotation with rotate3d on.
Example Usage
An example of using this function is provided as SGraamboTCPtoolM16translation followed by SGofgca2subplots, demonstrating how to extract and visualize solids from the current axis.
Algorithm explaination created using ChatGPT on 2025-08-19 00:14. (Please note: No guarantee for the correctness of this explanation)
Last html export of this page out of FM database by TL: 2025-09-21