plotruler4SG
by Tim C. Lueth, SG-Lib Toolbox: SolidGeometry 5.6 - Visualization
Introduced first in SolidGeometry 5.2, Creation date: 2022-06-01, Last change: 2025-09-15
creates dimensions on the outside of a geometric body
See Also: plotruler4SG
, plotrulerline
, SGruler
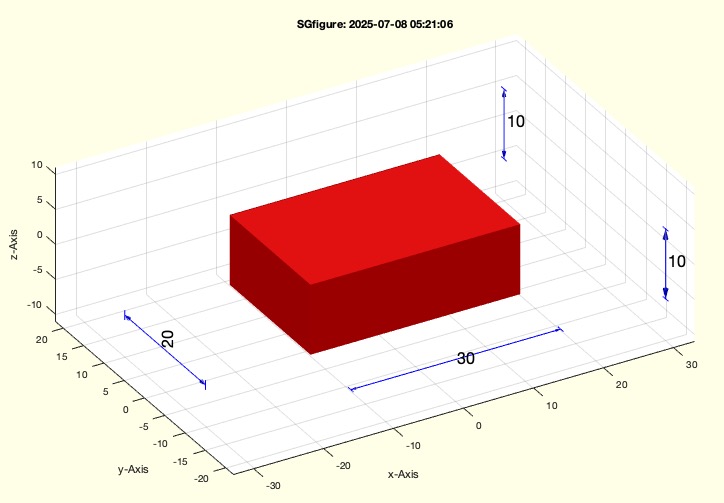
Example Illustration
Syntax
h=plotruler4SG([SG])
Input Parameter
SG: | | Solid geometry for displaying scales |
Output Parameter
Examples
SGfigure(-30,30); SGplotalpha(SGbox); plotruler4SG;
SGfigure(-30,30); SGplotalpha(SGsample(17)); plotruler4SG(SGsample(17));
Copyright 2022-2025 Tim C. Lueth. All rights reserved. The code is the property of Tim C. Lueth and may not be redistributed or modified without explicit written permission. This software may be used free of charge for academic research and teaching purposes only. Commercial use, redistribution, modification, or reverse engineering is strictly prohibited. Access to source code is restricted and granted only under specific agreements. For licensing inquiries or commercial use, please contact: Tim C. Lueth
Algorithm (Workflow)
This function, plotruler4SG, is designed to create dimension lines (rulers) on the outside of a geometric body. It is part of the SolidGeometry library and was introduced in version 5.2.
Input Parameters
- SG: This is the solid geometry object for which the scales or rulers are to be displayed. If not provided, the function attempts to retrieve the current geometry from the active axes.
Output Results
- h: Handles to the ruler lines that are created by the function.
Algorithm Steps
- The function begins by retrieving the solid geometry object
SG from the input parameters. If SG is not provided, it defaults to the current geometry in the active axes.
- It sets a ruler ratio
rr to 0.05, which might be used for scaling or positioning the rulers.
- The function
sofBB is called with SG to obtain several parameters: s, ss, cp, and bb. These likely represent size, scale, center point, and bounding box of the geometry.
- Coordinates for the start and end of the rulers are calculated using the bounding box
bb and scale ss.
- An empty array
h is initialized to store handles to the ruler lines.
- Three ruler lines are plotted using the
plotrulerline function, which takes start and end points as arguments. These lines are added to the h array.
- Unique x, y, and z coordinates are extracted from the vertex list
SG.VL.
- The z-coordinates are rounded and filtered to ensure a minimum distance
del of 2.0 between them. This is done using a loop that accumulates distances and selects points that meet the criteria.
- The filtered z-coordinates are used to create a set of points
PL for additional ruler lines.
- Additional ruler lines are plotted between consecutive points in
PL and added to the h array.
- The axis limits are adjusted using the
BBgrow function to ensure all rulers are visible, with a growth factor of 2.2.
Algorithm explaination created using ChatGPT on 2025-08-19 08:21. (Please note: No guarantee for the correctness of this explanation)
Last html export of this page out of FM database by TL: 2025-09-21