by Tim C. Lueth, SG-Lib Toolbox: SolidGeometry 5.6 - Visualization
Introduced first in SolidGeometry 4.2, Creation date: 2018-03-08, Last change: 2025-09-14
SGplot4(SG,[])
SG: | Solid Geometry |
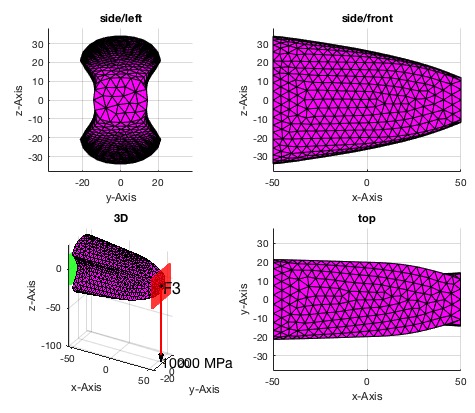
SGplot4(SGsample(25),'m')
The function SGplot4 is designed to plot a solid geometry object in four different views using MATLAB. It is part of the SolidGeometry library and is used for visualization purposes.
SGplotalpha function. These parameters can be used to customize the appearance of the plots, such as color or transparency.SGfigure, which likely sets up a new figure window for plotting.subplot function, allowing for four separate plots within the same figure.subplot(2,2,1); view(90,0); - This sets the first subplot to show a side or left view of the solid.subplot(2,2,2); view(0,0); - This sets the second subplot to show a side or front view of the solid.subplot(2,2,4); view(0,90); - This sets the fourth subplot to show a top view of the solid.subplot(2,2,3); view(30,30); - This sets the third subplot to show a 3D perspective view of the solid.SGplotalpha function is called with the solid geometry and any additional parameters. This function is responsible for the actual rendering of the solid in the specified view.The function does not return any values; its purpose is solely to create a visual representation of the solid geometry in multiple views.
Algorithm explaination created using ChatGPT on 2025-08-18 22:30. (Please note: No guarantee for the correctness of this explanation)