VLFLplotmanifold
by Tim C. Lueth, SG-Lib Toolbox: SolidGeometry 5.6 - Visualization
Introduced first in SolidGeometry 1.1, Creation date: 2014-01-12, Last change: 2025-09-14
plots a the non manifold points, edges, and facets of a solid
Description
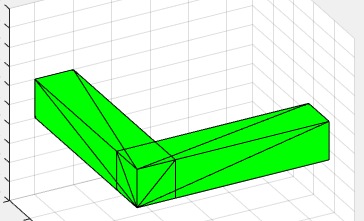
facets have different colors depending on the number of isolated edges:
green: ok
blue: one edge of the facet is free
magenta: two edges of the facet are free
red: three edges of the facet are free
cyan: All edges that are free
Example Illustration
Syntax
VLFLplotmanifold(VL,FL);
Input Parameter
VL: | | Vertex list |
FL: | | Facet list |
Examples
WORK in PROGRESS
Copyright 2014-2025 Tim C. Lueth. All rights reserved. The code is the property of Tim C. Lueth and may not be redistributed or modified without explicit written permission. This software may be used free of charge for academic research and teaching purposes only. Commercial use, redistribution, modification, or reverse engineering is strictly prohibited. Access to source code is restricted and granted only under specific agreements. For licensing inquiries or commercial use, please contact: Tim C. Lueth
Algorithm (Workflow)
This algorithm visualizes the non-manifold points, edges, and facets of a solid using a color-coded system to indicate the status of each facet based on the number of isolated edges.
Input Parameters
- VL: Vertex list, which contains the coordinates of the vertices of the solid.
- FL: Facet list, which contains the indices of the vertices that form each facet of the solid.
Algorithm Steps
- Generate a Delaunay triangulation from the vertex list (VL) and facet list (FL) using the function
TriRepofVLFL(VL,FL). This function returns a triangulation object dt with properties X (vertices) and Triangulation (facets).
- Update
VL and FL with the vertices and facets from the triangulation object dt.
- If the facets have four vertices, update
FL to include only the free boundary facets using freeboundary(dt).
- Iterate over each facet in
FL:
- Find the neighbors of the current facet using
neighbors(dt,i).
- Count the number of
NaN values in the neighbors list, which indicates isolated edges.
- Use a color-coding system to plot the facet based on the number of isolated edges:
nn == 0: Plot the facet in green, indicating no isolated edges.nn == 1: Plot the facet in blue, indicating one isolated edge.nn == 2: Plot the facet in magenta, indicating two isolated edges.nn == 3: Plot the facet in red, indicating three isolated edges.
- For each edge of the facet, check if it is isolated (i.e., has a
NaN neighbor) and plot it in red with a line width of 4 using VLELplots.
Algorithm explaination created using ChatGPT on 2025-08-19 06:59. (Please note: No guarantee for the correctness of this explanation)
Last html export of this page out of FM database by TL: 2025-09-21