camplot
by Tim C. Lueth, SG-Lib Toolbox: SolidGeometry 5.6 - Visualization
Introduced first in SolidGeometry 3.4, Creation date: 2017-02-21, Last change: 2025-08-18
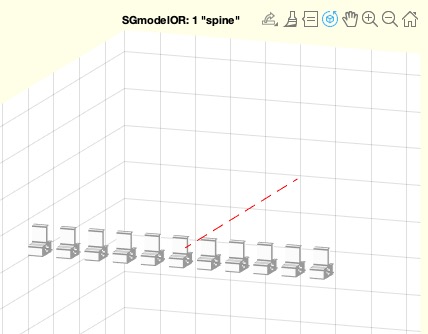
plots a line of the current camera position in the axis
See Also: , camset
, tcamera
Example Illustration
Syntax
[p0,p1,v,a]=camplot
Output Parameter
p0: | | CameraPosition |
p1: | | CameraTarget |
v: | | CameraViewAngle |
a: | | axis |
Examples
SGfigure; SGmodelOR(1), camplot % Afterwards rotate the image by mouse movement
Copyright 2017-2025 Tim C. Lueth. All rights reserved. The code is the property of Tim C. Lueth and may not be redistributed or modified without explicit written permission. This software may be used free of charge for academic research and teaching purposes only. Commercial use, redistribution, modification, or reverse engineering is strictly prohibited. Access to source code is restricted and granted only under specific agreements. For licensing inquiries or commercial use, please contact: Tim C. Lueth
Algorithm (Workflow)
This function, camplot, is designed to plot a line representing the current camera position in a MATLAB figure axis. It is part of the SolidGeometry library and was introduced in version 3.4.
Input Parameters
The function does not take any input parameters.
Output Results
- p0: The current camera position in the axis.
- p1: The target point that the camera is looking at.
- v: The camera's view angle.
- a: The current axis limits.
Algorithm Steps
- Retrieve the current axis limits using the
axis function and store it in variable a.
- Check if the axis is 2D by verifying if the size of
a is 4. If true, adjust the view slightly by adding 0.1 to both view angles using the view function, and update the axis limits.
- Calculate the radius
r as half the Euclidean norm of the axis dimensions, which is used to determine the length of the line to be plotted.
- Retrieve the camera's view angle, position, and target using the
get function with gca (get current axis).
- Plot a line from a point along the line of sight from the camera to the target, using the
lplot function. The line is styled as a red dashed line with a width of 1 and a length of 5.
- Reset the axis limits to their original values using the
axis function.
- Call the
show function to update the display.
Algorithm explaination created using ChatGPT on 2025-08-18 23:07. (Please note: No guarantee for the correctness of this explanation)
Last html export of this page out of FM database by TL: 2025-09-21