FSplot
by Tim C. Lueth, SG-Lib Toolbox: SolidGeometry 5.6 - Visualization
Introduced first in SolidGeometry 4.0, Creation date: 2017-07-27, Last change: 2025-09-14
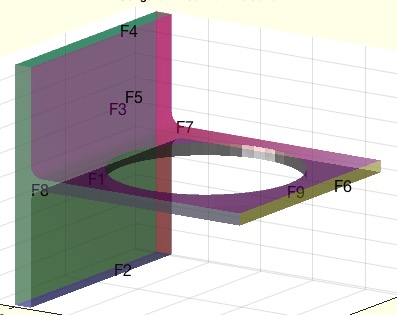
plots the featureEdges of TR, SG or VLFL
Description
Similar to FE plot, it plots the feature surfaces of a solid;
Feature surfaces are not officially supported by matlab, nevertheless there the pde toolbox for instance has a facet plot, which is comparable to FS.
In contrast to pdeplotfaces, the SG-Lib gives you full access to the feature surfaces using surfacesofSG. Especially for automatic design it is necessary to select surfaces in many different ways, such as a normal vector. Also information on the faces are required.
See Also: FEplot
, surfacesofSG
, textVLFS
, pdeplotfaces
Example Illustration
Syntax
h=FSplot([TR,alp,fsi,col,siz]);
Input Parameter
TR: | | surface (Tetrahedron, Triangulation, Solid) |
alp: | | alpha value for neigbor facets |
fsi: | | selected FS; depend on alpha; default is all |
col: | | color of FS; default is colofn |
siz: | | size of descriptiors; default is 16 |
Output Parameter
h: | | handle to graphics object consisting of text and patches |
Examples
FSplot(SGsample(3))
SG=SGreadSTL(which('BracketWithHole.stl'),1000);
SGfigure; FSplot(SG,1)
SGfigure; FSplot(SG,0.1);
SGfigure; FSplot(SG,1,[4 6]);
SGfigure; FSplot(SG,1,[4 6],'r');
SGfigure; FSplot(SG,1,[4 6],'r',30);
Copyright 2017-2025 Tim C. Lueth. All rights reserved. The code is the property of Tim C. Lueth and may not be redistributed or modified without explicit written permission. This software may be used free of charge for academic research and teaching purposes only. Commercial use, redistribution, modification, or reverse engineering is strictly prohibited. Access to source code is restricted and granted only under specific agreements. For licensing inquiries or commercial use, please contact: Tim C. Lueth
Last html export of this page out of FM database by TL: 2025-09-21