plotannotationSG
by Tim C. Lueth, SG-Lib Toolbox: SolidGeometry 5.6 - Visualization
Introduced first in SolidGeometry 5.1, Creation date: 2022-02-07, Last change: 2025-09-15
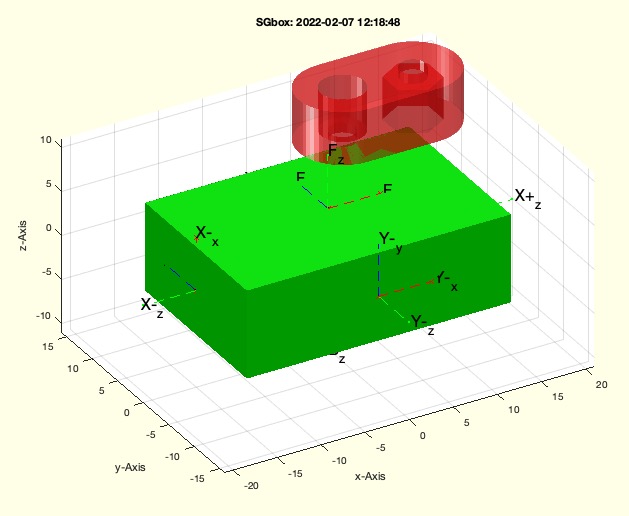
plots a solid into the upper right corner of the current graphics axis
Description
In some cases it is interesting to see a reference body in the picture for a size comparison. In the case of four-bar joints, for example, the small technically feasible link of a four-bar joint with known assembly method
See Also: plotannotation
, SGofR12
Example Illustration
Syntax
h=plotannotationSG(SG,[])
Input Parameter
Output Parameter
Examples
SGbox; plotannotationSG(SGofR12([5 2.5 6]))
Copyright 2022-2025 Tim C. Lueth. All rights reserved. The code is the property of Tim C. Lueth and may not be redistributed or modified without explicit written permission. This software may be used free of charge for academic research and teaching purposes only. Commercial use, redistribution, modification, or reverse engineering is strictly prohibited. Access to source code is restricted and granted only under specific agreements. For licensing inquiries or commercial use, please contact: Tim C. Lueth
Algorithm (Workflow)
This function, plotannotationSG, is designed to plot a solid geometry (SG) into the upper right corner of the current graphics axis. It is part of the SolidGeometry library and was introduced in version 5.1. The function is useful for visualizing a reference body for size comparison, such as in the case of four-bar joints.
Input Parameters
- SG: The solid geometry object that needs to be plotted.
- varargin: Additional optional parameters, including 'time'.
Output Results
- h: A handle to the plotted object.
Algorithm Steps
- Extract the 'time' parameter from
varargin using getfuncparamStr. If not provided, default to 0.
- Retrieve the current axis limits using
axis.
- Calculate the bounding box of the current axis using
SGofBB with a margin of 0.
- Transform the solid geometry
SG to align it with the top, back, and right of the bounding box using SGtransrelSG.
- Plot the transformed solid geometry with a red color and 50% transparency using
SGplotalpha.
- If the 'time' parameter is greater than 0, pause the execution for the specified time using
dbpause, then delete the plot and clear the handle.
Algorithm explaination created using ChatGPT on 2025-08-19 00:04. (Please note: No guarantee for the correctness of this explanation)
Last html export of this page out of FM database by TL: 2025-09-21