VLplotdelaunay
by Tim C. Lueth, SG-Lib Toolbox: SolidGeometry 5.6 - Visualization
Introduced first in SolidGeometry 5.0, Creation date: 2020-09-12, Last change: 2025-09-14
simple inspection fnct
Description
Used to analyze VLFLofCVLdelaunay3D
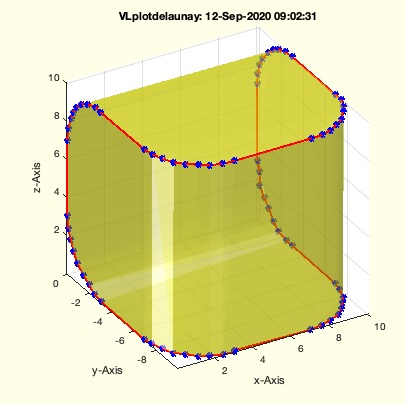
Example Illustration
Syntax
VLplotdelaunay(VL,[c,al])
Input Parameter
VL: | | Vertex list |
c: | | color of solid; default is 'y' |
al: | | alpha of solid; default is 1 |
Examples
VL=VLsample(25); VLplotdelaunay(VL);
Copyright 2020-2025 Tim C. Lueth. All rights reserved. The code is the property of Tim C. Lueth and may not be redistributed or modified without explicit written permission. This software may be used free of charge for academic research and teaching purposes only. Commercial use, redistribution, modification, or reverse engineering is strictly prohibited. Access to source code is restricted and granted only under specific agreements. For licensing inquiries or commercial use, please contact: Tim C. Lueth
Algorithm (Workflow)
This function, VLplotdelaunay, is designed for visualizing a Delaunay triangulation of a given set of vertices. It is part of the SolidGeometry library and was introduced in version 5.0. The function takes a vertex list and optional parameters for color and transparency.
Input Parameters
- VL: The vertex list, which is a set of points in 2D or 3D space that will be used to create the Delaunay triangulation.
- c: The color of the solid, with a default value of 'y' (yellow). This parameter is optional and can be specified by the user.
- al: The alpha (transparency) of the solid, with a default value of 0.5. This parameter is also optional and can be specified by the user.
Algorithm Steps
- The function begins by retrieving the optional parameters
c and al using the getfuncparams function. If these parameters are not provided, they default to 'y' and 0.5, respectively.
- The function then sets up a figure for plotting using
SGfigure(-30,30), which likely configures the viewing window or axes limits.
- Warnings related to duplicate points in the Delaunay triangulation are temporarily turned off using
warning('off','MATLAB:DelaunayTri:DupPtsWarnId').
- The function
VLFLofVL is called with the vertex list VL to obtain the vertex list VLN and face list FLN for plotting.
- Warnings are restored to their previous state.
- The function
VLFLplotalpha is used to plot the triangulation with the specified color c and transparency al.
- The function
CVLplot is called to plot the vertex list VL with a red line ('r-') and a line width of 2.
- Finally, the function
VLplot is used to plot the vertices themselves as blue stars ('b*') with a size of 2.
Algorithm explaination created using ChatGPT on 2025-08-18 22:51. (Please note: No guarantee for the correctness of this explanation)
Last html export of this page out of FM database by TL: 2025-09-21