by Tim C. Lueth, SG-Lib Toolbox: SolidGeometry 5.6 - Visualization
Introduced first in SolidGeometry 5.0, Creation date: 2020-09-04, Last change: 2025-08-18
See Also: VLofgca
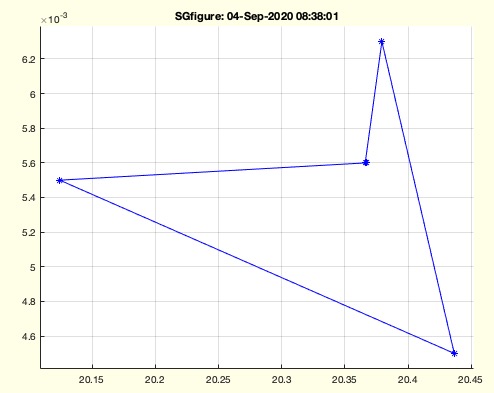
VL=VLofgcalines
VL: |
VL=[20.4365    0.0045    7.4322
20.1242    0.0055    4.1943
20.3669    0.0056    4.1475
20.3660    0.0056    4.1477
20.3792    0.0063    1.7431]
SGfigure; CVLplots(VL); zoomVL(VLofgcalines); axis normal
This algorithm extracts vertex points from line objects in the current axes of a MATLAB figure and compiles them into a list. The function is part of the SolidGeometry library and is used for visualization purposes.
The function VLofgcalines does not take any input parameters. It operates on the current axes in a MATLAB figure, which is accessed using gca.
The function returns a matrix VL, where each row represents a vertex point with its X, Y, and Z coordinates.
findobj(gca, 'Type', 'Line'). This returns a handle array h of line objects.VL with 100,000 rows and 3 columns to store the vertex points. This is a preallocation step to improve performance.k to zero. This counter keeps track of the number of vertex points added to VL.h:VLi where each row is a vertex point.ni in VLi.VLi into the appropriate rows of VL, starting from the row indexed by k+1.k by adding ni to it.VL to only include the rows that contain vertex points, i.e., the first k rows.The function can be used in conjunction with other visualization functions such as SGfigure, CVLplots, and zoomVL to display and manipulate the vertex points in a MATLAB figure.