VLFLplotfi
by Tim C. Lueth, SG-Lib Toolbox: SolidGeometry 5.6 - Visualization
Introduced first in SolidGeometry 5.0, Creation date: 2020-09-11, Last change: 2025-09-14
plots the scenery around some vertices in unequal scale
Description
Is not a plotting function more a inspection function
better would be
VLFLshowvi
VLFLinspectvi
See Also: VLFLofVLELdelaunay3D
, VLFLremoveFacet
Example Illustration
Syntax
VLFLplotfi(VL,FL,fi);
Input Parameter
VL: | | Vertex list |
FL: | | Facet list |
fi: | | facet index |
Examples
SGsphere(5); X=ans  % Create a shpere
VLFLplotfi(X.VL,X.FL,616);
Copyright 2020-2025 Tim C. Lueth. All rights reserved. The code is the property of Tim C. Lueth and may not be redistributed or modified without explicit written permission. This software may be used free of charge for academic research and teaching purposes only. Commercial use, redistribution, modification, or reverse engineering is strictly prohibited. Access to source code is restricted and granted only under specific agreements. For licensing inquiries or commercial use, please contact: Tim C. Lueth
Algorithm (Workflow)
This function, VLFLplotfi, is designed to inspect and visualize a specific facet within a 3D geometry. It is part of the SolidGeometry library and is used for visualization purposes.
Input Parameters
- VL: Vertex List - A matrix where each row represents the coordinates of a vertex in 3D space.
- FL: Facet List - A matrix where each row contains indices of vertices that form a facet.
- fi: Facet Index - An integer representing the index of the facet to be inspected and visualized.
Algorithm Steps
- Initialize a figure with a specific view using
SGfigure(-30,30).
- Identify the unique vertices associated with the specified facet index
fi using vi=unique(FL(fi,:)).
- Call the function
FLofVLFLvi to obtain different facet indices (fi3, fi2, fi1, fi0) based on the vertices vi.
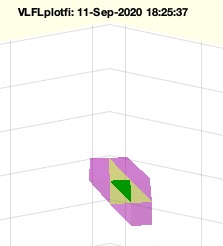
- Visualize the facets using
VLFLplotalpha with different colors and transparency levels:
- Green for facets in
fi3.
- Yellow with 50% transparency for facets in
fi2.
- Magenta with 50% transparency for facets in
fi1.
- Calculate the free boundary edges using
VLFLfreeboundary for the combined facets fi1, fi2, fi3.
- Select vertices and edges using
VLELselect and plot them in red with a line width of 2 using VLELplots.
- Generate a new set of facets using
VLFLofVLELdelaunay3D and adjust indices with fl=si(fl).
- Ensure the edge list
EL is in the correct orientation.
- Plot the new facets in blue with 50% transparency using
VLFLplotalpha.
- Plot the original facets in white with 50% transparency using
VLFLplotalpha.
- Combine the original and new facets into
FL.
- Clear the current axis with
cla and re-plot all facets using VLFLplotalpha.
- Set the axis to normal and zoom into the vertices of interest using
zoomVL(VL(vi,:),1).
Algorithm explaination created using ChatGPT on 2025-08-19 06:59. (Please note: No guarantee for the correctness of this explanation)
Last html export of this page out of FM database by TL: 2025-09-21