plotCVL
by Tim C. Lueth, SG-Lib Toolbox: SolidGeometry 5.6 - Visualization
Introduced first in SolidGeometry 1.0, Creation date: 2012-07-30, Last change: 2025-09-14
plots facet that is enclosed by the vertex contour list
Description
Quick and dirty procedure
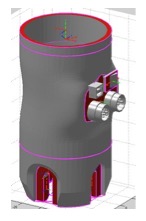
Example Illustration
Syntax
plotCVL(VL,[c])
Input Parameter
VL: | | Vertex list |
c: | | optional color, default is 'r' |
Copyright 2012-2025 Tim C. Lueth. All rights reserved. The code is the property of Tim C. Lueth and may not be redistributed or modified without explicit written permission. This software may be used free of charge for academic research and teaching purposes only. Commercial use, redistribution, modification, or reverse engineering is strictly prohibited. Access to source code is restricted and granted only under specific agreements. For licensing inquiries or commercial use, please contact: Tim C. Lueth
Algorithm (Workflow)
This algorithm is a MATLAB function named plotCVL that is used to plot a facet enclosed by a vertex contour list. It is part of the SG-Library and was created by Tim Lueth in 2012. The function is designed for visualization purposes.
Input Parameters
- VL: This is the vertex list, which is a matrix where each row represents a vertex in 2D or 3D space.
- c: This is an optional parameter that specifies the color of the plot. The default color is 'r' (red) if not provided.
Algorithm Steps
- Initialize the color
c to 'r'. If a second argument is provided, set c to this value.
- Determine the number of vertices
n by checking the number of rows in VL.
- If
n is less than 3, exit the function as it is not possible to form a triangle with fewer than 3 vertices.
- Create a face list
FL that defines simple triangles using the vertices. This is done by creating a matrix where each row represents a triangle formed by the first vertex and two consecutive vertices from the list.
- Call the function
VLFLplot with the vertex list VL, face list FL, and color c to plot the facet.
Algorithm explaination created using ChatGPT on 2025-08-18 21:54. (Please note: No guarantee for the correctness of this explanation)
Last html export of this page out of FM database by TL: 2025-09-21