by Tim C. Lueth, SG-Lib Toolbox: SolidGeometry 5.6 - Visualization
Introduced first in SolidGeometry 2.1, Creation date: 2015-01-27, Last change: 2025-09-14
See Also: pplot
, lplot
, tfplot
, tlplot
, slplot
, plotTP
, plotL
, plotT
plotT2P(p,[c,s,w,N])
p: | Point or | |
c: | color | |
s: | width | |
w: | String for name | |
N: | Name of Frame |
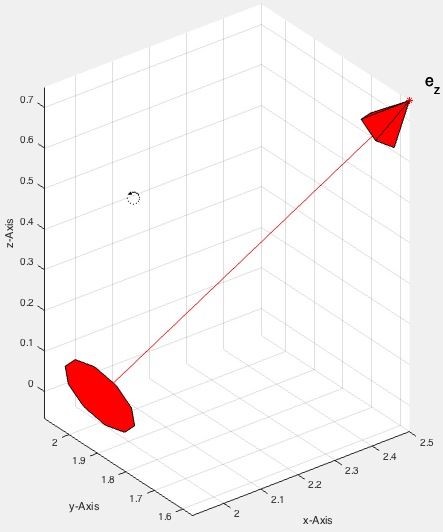
The function plotT2P is designed to plot a homogeneous transformation matrix as a straight line vector. It is part of the SolidGeometry library and was introduced in version 2.1. The function takes a point and optional parameters to customize the plot.
c, s, w, and N based on the number of input arguments.p to extract the ez vector and the point p:
p is 3x3, set ez to the second column and p to the third column.p is 4x4 or 3x4, set ez to the third column and p to the fourth column.p does not match these sizes, use the first optional argument as ez and adjust other parameters accordingly.p and ez are 3D vectors by appending a zero if they are 2D.T using the function Tof2P with p and ez.t and the ez vector from T.zt for the plot based on the presence of N.lplot from t to t + s*ez with the specified color and width.PLcircle and transform it with VLtransT using T.patch.t using pplot with a black dot.