ELplot
by Tim C. Lueth, SG-Lib Toolbox: SolidGeometry 5.6 - EL/Edge Lists
Introduced first in SolidGeometry 4.1, Creation date: 2017-09-09, Last change: 2025-09-14
plots the graph of the given edge list
Description
This function uses the digraph class and plot for drawing the edge list.
See Also: graphofEL
Example Illustration
Syntax
[h,G]=ELplot(EL)
Input Parameter
Output Parameter
h: | | handle to plot |
G: | | digraaph of the edge list |
Examples
ELplot(FEofSG(SGsample(32)));
CPL=[PLcircle(5);nan nan;PLcircle(3)]; [~,EL]=PLELofCPL(CPL)
SGfigure; ELplot(EL);
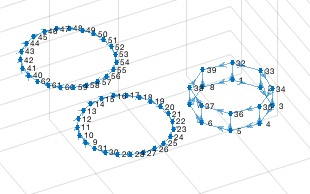
X=SGsample(26); EL=ELofFL(X.FL); SGfigure; ELplot(EL,'layout','force3')
Copyright 2017-2025 Tim C. Lueth. All rights reserved. The code is the property of Tim C. Lueth and may not be redistributed or modified without explicit written permission. This software may be used free of charge for academic research and teaching purposes only. Commercial use, redistribution, modification, or reverse engineering is strictly prohibited. Access to source code is restricted and granted only under specific agreements. For licensing inquiries or commercial use, please contact: Tim C. Lueth
Algorithm (Workflow)
This function, ELplot, is designed to plot a graph from a given edge list using MATLAB's digraph class. Below is a detailed explanation of the algorithm and its parameters.
Input Parameters
- EL: The edge list, which is a matrix where each row represents an edge between two nodes.
- varargin: Optional parameters that can be passed to customize the plot layout.
Output Results
- h: Handle to the plot, which can be used for further customization or querying of the plot.
- G: A directed graph object created from the edge list.
Algorithm Steps
- Check if the edge list
EL is empty. If it is, return empty handles for both h and G.
- Create a list of node indices
avi from 1 to the maximum node index found in EL.
- Convert these indices to strings and store them in a cell array
cvi.
- Use the function
VLELselect to filter the nodes and edges, reducing the graph to only those nodes that are part of the edge list.
- Create a directed graph
G using the filtered edge list and node names.
- Plot the graph
G using the plot function. If no additional arguments are provided, use the 'force3' layout. Otherwise, use the layout specified in varargin.
Example Usage
Here are some examples of how to use the ELplot function:
ELplot(FEofSG(SGsample(32)));CPL=[PLcircle(5);nan nan;PLcircle(3)]; [~,EL]=PLELofCPL(CPL); SGfigure; ELplot(EL);X=SGsample(26); EL=ELofFL(X.FL); SGfigure; ELplot(EL,'layout','force3');
Algorithm explaination created using ChatGPT on 2025-08-19 01:22. (Please note: No guarantee for the correctness of this explanation)
Last html export of this page out of FM database by TL: 2025-09-21