by Tim C. Lueth, SG-Lib Toolbox: SolidGeometry 5.6 - EL/Edge Lists
Introduced first in SolidGeometry 4.0, Creation date: 2017-07-05, Last change: 2025-09-14
G=graphofEL(EL,[n])
EL: | Edge list; must have unique entries! | |
n: | optional number of vertices |
G: | MATLAB's Graph struct using Edges and Nodes |
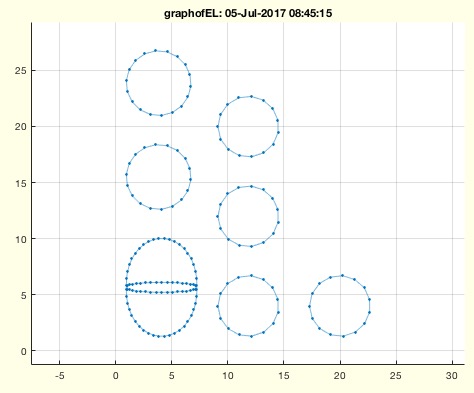
EL=featureEdges(TR3ofSG(SGsample(25)),1)
graphofEL(EL)
graphofEL(featureEdges(TR3ofSG(SGsample(3)),1))This MATLAB function, graphofEL, creates an undirected graph model from an edge list. It is designed to analyze surface models using graph theory, which is useful for understanding structures at an abstract level. The function is part of the SolidGeometry library and was introduced in version 4.0.
n is provided. If it is, assign it to the variable n.EL contains unique rows by using the unique function.n is provided, create a directed graph using the digraph function with the specified number of vertices. Otherwise, create a directed graph without specifying the number of vertices.nargout==0), call the SGfigure function to create a new figure and use the ELplot function to plot the edge list.To use the function, you can call it with an edge list obtained from the featureEdges function:
EL = featureEdges(TR3ofSG(SGsample(25)), 1);
graphofEL(EL);
graphofEL(featureEdges(TR3ofSG(SGsample(3)), 1));
This example demonstrates how to create a graph from an edge list derived from a sample surface model.
Algorithm explaination created using ChatGPT on 2025-08-19 01:29. (Please note: No guarantee for the correctness of this explanation)