by Tim C. Lueth, SG-Lib Toolbox: SolidGeometry 5.6 - PL/Point Lists
Introduced first in SolidGeometry 5.2, Creation date: 2022-03-09, Last change: 2025-09-15
PLN=PLaddauxpoints(PL,d)
PL: | Open Point list | |
d: | distance of axuilary points |
PLN: | New Point list |
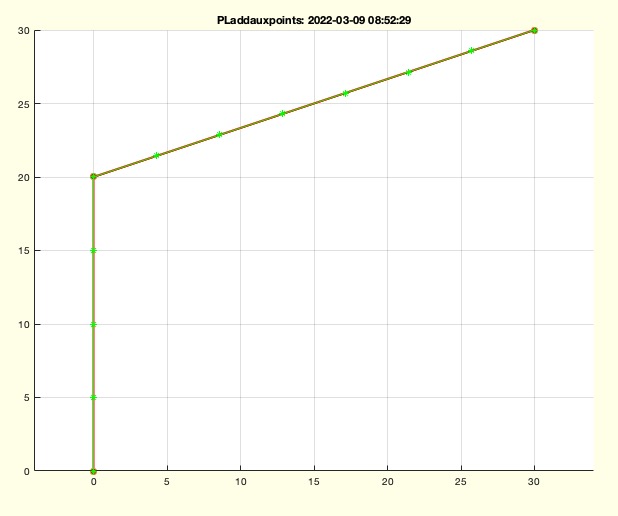
CPLF=[-0 -0 ; 0 20; 30 30]; PLaddauxpoints(CPLF,5); 	% Open Contour   PL add...
CPLF=[-0 -0 ; 0 20; 30 30]; RLaddauxpoints(CPLF,5); 	% Closed Contour RL add..
CPLF=[-0 -0 ; 0 20; 30 30]; CPLaddauxpoints(CPLF,5); % Nested Contours CPL add..This function, PLaddauxpoints, is designed to add auxiliary points to an open point list. It is part of the SolidGeometry library and was introduced in version 5.2. The function is similar to RLaddauxpoints but is specifically for open point lists.
PL as well as the newly added auxiliary points.RLaddauxpoints with the parameters PL, d, and false. This function is responsible for adding the auxiliary points to the open point list.nargout==0), the function will plot the original and new point lists using the SGfigure and PLplot functions. The original points are plotted in red with a star marker and a line width of 2, while the new points are plotted in green with a star marker and a line width of 1.Here are some examples of how the function can be used:
CPLF=[-0 -0 ; 0 20; 30 30]; PLaddauxpoints(CPLF,5); - This adds auxiliary points to an open contour.CPLF=[-0 -0 ; 0 20; 30 30]; RLaddauxpoints(CPLF,5); - This adds auxiliary points to a closed contour.CPLF=[-0 -0 ; 0 20; 30 30]; CPLaddauxpoints(CPLF,5); - This adds auxiliary points to nested contours.