by Tim C. Lueth, SG-Lib Toolbox: SolidGeometry 5.6 - PL/Point Lists
Introduced first in SolidGeometry 5.0, Creation date: 2021-02-07, Last change: 2025-09-15
h=PLplotdiscretesample(PL,[])
PL: | Signal [k x()] |
h: | handle to plot |
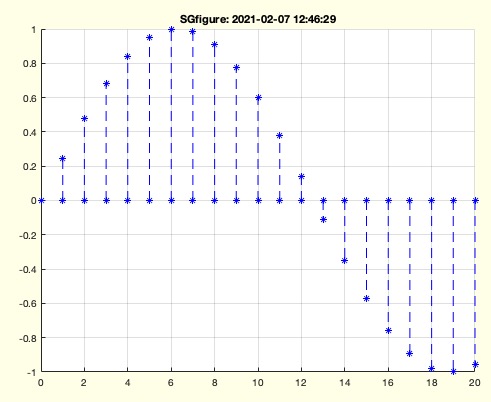
SGfigure; PLplotdiscretesample([[0:20]',sin([0:20]/4)'],'b*--'); axis normalThis function, PLplotdiscretesample, is designed to plot a piecewise linear (PL) signal as a digital signal to avoid misinterpretation. It is part of the SolidGeometry library and is used for educational purposes in teaching mechatronics.
PL is a table. If it is, convert it to an array using table2array and store the original table in TPL.PL has more rows than columns. If not, transpose PL.PL has only one column, create a new matrix with an index column starting from 0 and append the original PL as the second column.PLD with the first column of PL and a column of zeros.lplots with PLD, PL, and any additional arguments from varargin to generate the plot.TPL is not empty, set the x-axis and y-axis labels using the variable names from TPL. If the input PL has a name, use it as the plot title.The function can be used as follows:
SGfigure; PLplotdiscretesample([[0:20]',sin([0:20]/4)'],'b*--'); axis normal
This example creates a plot of a sine wave sampled at discrete intervals.
Algorithm explaination created using ChatGPT on 2025-08-19 00:54. (Please note: No guarantee for the correctness of this explanation)