PLrand
by Tim C. Lueth, SG-Lib Toolbox: SolidGeometry 5.6 - PL/Point Lists
Introduced first in SolidGeometry 2.0, Creation date: 2014-12-02, Last change: 2025-09-14
returns a point list with random points
Description
mainly r*rand(n,2) but combined with PLsortC
See Also: PLcircle
, PLcircseg
, PLevolvente
, PLgearDIN
, PLkidney
, PLspiral
, PLsquare
, PLstar
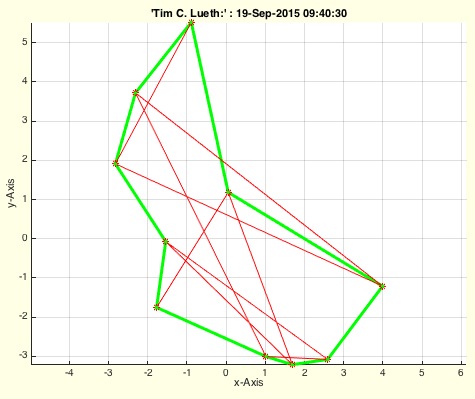
Example Illustration
Syntax
[PL,CPL]=PLrand([n,r,c])
Input Parameter
n: | | number of points; default is 10 |
r: | | Radius; default is 10 |
c: | | Center; default is [0 0] |
Output Parameter
PL: | | Point list nx2 (unsorted) |
CPL: | | Point list nx2 (sorted as contour), not closed |
Examples
close all;
CPLplot(PLsortC(PLrand(20,10)));   view(0,90); axis equal;
Copyright 2014-2025 Tim C. Lueth. All rights reserved. The code is the property of Tim C. Lueth and may not be redistributed or modified without explicit written permission. This software may be used free of charge for academic research and teaching purposes only. Commercial use, redistribution, modification, or reverse engineering is strictly prohibited. Access to source code is restricted and granted only under specific agreements. For licensing inquiries or commercial use, please contact: Tim C. Lueth
Algorithm (Workflow)
This algorithm generates a list of random points and sorts them into a contour. It is part of the SG-Library and was created by Tim Lueth. The function is named PLrand and it returns two outputs: an unsorted point list and a sorted contour point list.
Input Parameters
- n: Number of points. Default is 10.
- r: Radius. Default is 10.
- c: Center. Default is [0, 0].
Output Results
- PL: An nx2 matrix representing the unsorted point list.
- CPL: An nx2 matrix representing the sorted point list as a contour, not closed.
Algorithm Steps
- Initialize default values for
n, r, and c.
- Check if input arguments are provided and update the default values accordingly.
- Generate a random point list
PL using r*rand(n,2).
- Calculate the centroid
C of the points in PL.
- Adjust the points in
PL to be centered around the specified center c.
- Sort the adjusted points into a contour using the function
PLsortC, resulting in CPL.
- If no output arguments are specified, plot the sorted and unsorted points using
CPLplot and PLplot.
- Set the axis limits and view for the plot.
Algorithm explaination created using ChatGPT on 2025-08-19 00:50. (Please note: No guarantee for the correctness of this explanation)
Last html export of this page out of FM database by TL: 2025-09-21