SGofgo
by Tim C. Lueth, SG-Lib Toolbox: SolidGeometry 5.6 - SG/Solids
Introduced first in SolidGeometry 5.0, Creation date: 2020-10-04, Last change: 2025-09-14
returns handle and surface arrays of a graphics objects
Description
This function is used to interactively decompose solids into multiple bodies. The handles of the solids are recorded.
See Also: SGofgca
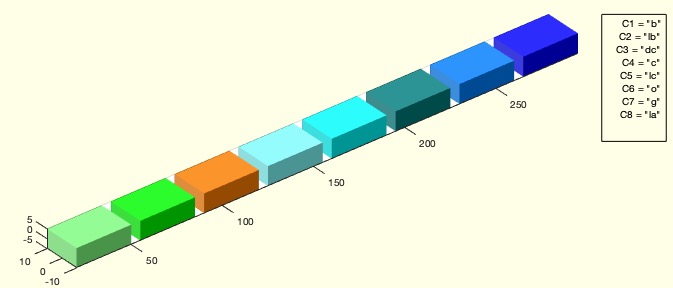
Example Illustration
Syntax
[SG,h]=SGofgo(go)
Input Parameter
Output Parameter
SG: | | Cell list of Solids |
h: | | array of handles |
Examples
SGsurfaces(SGcolorsample); pause(1); SGofgo(gca)    % Colored and separated surfaces
SGcolorsample; pause(1); SGofgo(gca)                % Colored by a single surface handle
Copyright 2020-2025 Tim C. Lueth. All rights reserved. The code is the property of Tim C. Lueth and may not be redistributed or modified without explicit written permission. This software may be used free of charge for academic research and teaching purposes only. Commercial use, redistribution, modification, or reverse engineering is strictly prohibited. Access to source code is restricted and granted only under specific agreements. For licensing inquiries or commercial use, please contact: Tim C. Lueth
Algorithm (Workflow)
This function, SGofgo, is designed to decompose graphics objects into multiple bodies and return their handles and surface arrays. It is part of the SolidGeometry library.
Input Parameters
- go: A graphics object, which can be a single object or a collection of objects. If not provided, the current axes (
gca) are used.
Output Results
- SG: A cell list of solids, where each cell contains the vertices, faces, and face vertex color data of a solid.
- h: An array of handles to the graphics objects of type 'Patch'.
Algorithm Steps
- Retrieve the graphics object using
getfuncparams. If no object is specified, use the current axes (gca).
- Find all objects of type 'Patch' within the graphics object and store their handles in
h.
- Initialize a cell array
SG to store the solid data for each patch.
- For each patch handle:
- Retrieve the vertices using
get(h(i),'Vertices').
- Retrieve the faces using
get(h(i),'Faces').
- Retrieve the face vertex color data using
get(h(i),'FaceVertexCData').
- Store this data in a structure
SGi and add it to the SG cell array.
- If no output arguments are specified:
- Iterate over each patch handle to set plot lighting and annotations.
- Use
nofcolmap to determine the color and string for each patch.
- Apply lighting to each patch using
setplotlight.
- Build an annotation string
AStr with color information.
- Delete existing textboxes and text objects in the root graphics object.
- Display the annotation using
plotannotation.
- Refresh the figure window with
shg.
Algorithm explaination created using ChatGPT on 2025-08-19 08:06. (Please note: No guarantee for the correctness of this explanation)
Last html export of this page out of FM database by TL: 2025-09-21