SGstretching
by Tim C. Lueth, SG-Lib Toolbox: SolidGeometry 5.6 - SG/Solids
Introduced first in SolidGeometry 2.1, Creation date: 2015-02-20, Last change: 2025-09-14
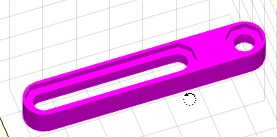
cuts a solid geometry in x and stretches in x
See Also:
Example Illustration

Syntax
A=SGstretching(A,dx,xlim)
Input Parameter
A: | | Solid geometry |
dx: | | add d to all x-coodinates |
xlim: | | for all x-coordinates > xlim |
Output Parameter
A: | | Stretched solid geoemtry |
Copyright 2015-2025 Tim C. Lueth. All rights reserved. The code is the property of Tim C. Lueth and may not be redistributed or modified without explicit written permission. This software may be used free of charge for academic research and teaching purposes only. Commercial use, redistribution, modification, or reverse engineering is strictly prohibited. Access to source code is restricted and granted only under specific agreements. For licensing inquiries or commercial use, please contact: Tim C. Lueth
Algorithm (Workflow)
This algorithm is designed to modify a solid geometry by stretching it along the x-axis. The function takes three input parameters and returns a modified version of the input geometry.
Input Parameters
- A: This is the solid geometry that will be modified. It is expected to be a data structure containing vertex information.
- dx: This is the amount by which the x-coordinates of the geometry will be increased. It is a scalar value.
- xlim: This is the threshold value for the x-coordinates. Only x-coordinates greater than this value will be modified.
Output
- A: The function returns the modified solid geometry with stretched x-coordinates.
Algorithm Steps
- The function begins by identifying all vertices in the solid geometry A where the x-coordinate is greater than or equal to the specified xlim value.
- For these identified vertices, the x-coordinate is increased by the value of dx.
- If no output argument is specified (nargout==0), the function will visualize the modified geometry using a specific view and lighting setup.
Visualization
If the function is called without an output argument, it will display the modified geometry using the following visualization settings:
- VLFLfigure(A,'g'): This command likely initializes a figure for displaying the geometry A with a specific color or style ('g' for green).
- view(-30,30): Sets the viewing angle of the 3D plot to azimuth -30 degrees and elevation 30 degrees.
- VLFLplotlight(1,0.9): Adds lighting to the plot, with parameters that control the light's intensity and position.
Algorithm explaination created using ChatGPT on 2025-08-18 21:55. (Please note: No guarantee for the correctness of this explanation)
Last html export of this page out of FM database by TL: 2025-09-21