SGwriteIcon
by Tim C. Lueth, SG-Lib Toolbox: SolidGeometry 5.6 - Import/Export
Introduced first in SolidGeometry 3.0, Creation date: 2016-11-12, Last change: 2025-09-14
Writes an Icon/JPG File with a 3D view of a SG
See Also: SGwriteSTL
, app_2012_11_09
, iconfilesearch
, iconofCPL
, iconlibTL
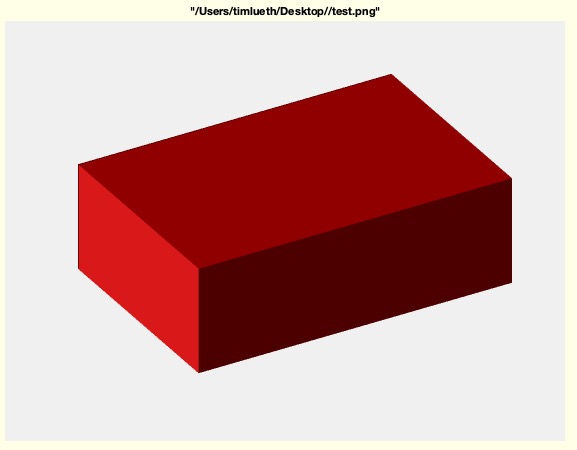
Example Illustration
Syntax
SGwriteIcon(SG,FName)
Input Parameter
SG: | | Solid Geometry |
FName: | | Full File Name. The Extension defines the Format (.JPG, .PNG) |
Examples
SGwriteIcon(SGbox,desktopdir('test.png'))
imreadlastchanged
Copyright 2016-2025 Tim C. Lueth. All rights reserved. The code is the property of Tim C. Lueth and may not be redistributed or modified without explicit written permission. This software may be used free of charge for academic research and teaching purposes only. Commercial use, redistribution, modification, or reverse engineering is strictly prohibited. Access to source code is restricted and granted only under specific agreements. For licensing inquiries or commercial use, please contact: Tim C. Lueth
Algorithm (Workflow)
This function, SGwriteIcon, is designed to create a 3D view of a solid geometry (SG) and save it as an image file. The function is part of the SolidGeometry library and was developed by Tim Lueth.
Input Parameters
- SG: This parameter represents the solid geometry object that you want to visualize and save as an image.
- FName: This is the full file name, including the path and extension, where the image will be saved. The extension determines the image format, such as .JPG or .PNG.
Algorithm Steps
- Check the number of input arguments using
nargin. If only one argument is provided (SG), set FName to a default path and file name, 'SGwriteIcon.PNG', in the desktop directory.
- Create a new figure window with a specific handle (3333) and clear any existing content using
cla.
- Set the figure's visibility to 'off' to prevent it from displaying on the screen.
- Plot the solid geometry using the function
SGplotalpha with the parameters SG, an empty string, and 1. This function likely handles the rendering of the 3D model.
- Remove any labels from the x and y axes using
ylabel('') and xlabel('').
- Set the view angle of the 3D plot to (-30, 30) using the
view function.
- Adjust the zoom level of the plot using
zoompatch with the volume of the solid geometry, and two zero parameters, which might control the zoom level or position.
- Set the axis to be tight around the plot using
axis tight and turn off the axis display with axis off.
- Use
drawnow and pause(0.01) to ensure the plot is fully rendered before capturing the frame.
- Capture the current frame of the figure using
getframe and store the image data in I.
- Write the captured image data to a file using
imwrite with the image data I.cdata and the specified file name FName.
- Close the figure window using
close(h) to free up system resources.
Algorithm explaination created using ChatGPT on 2025-08-18 23:59. (Please note: No guarantee for the correctness of this explanation)
Last html export of this page out of FM database by TL: 2025-09-21