VLBezier4P
by Tim C. Lueth, SG-Lib Toolbox: SolidGeometry 5.6 - Analytical Geometry
Introduced first in SolidGeometry 1.0, Creation date: 2012-04-25, Last change: 2025-09-14
simple fnct to calculate a 3D Bezier curve
See Also: VLBezierC
, VLradialEdges
, VLtangentcirc
Example Illustration
Syntax
VL=VLBezier4P(p1,p2,p3,p4,[n]);
Input Parameter
p1: | | 1st point |
p2: | | 2nd point |
p3: | | 3rd point |
p4: | | 4th point |
n: | | number of supporting points |
Output Parameter
VL: | | Vertex list of the bezier spline |
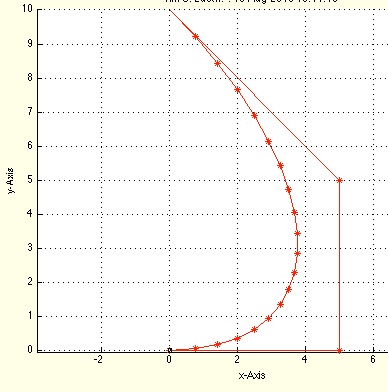
Examples
PL=[0 0 0; 5 0 0; 5 5 0; 0 10 0]
VL=VLBezier4P(PL(1,:),PL(2,:),PL(3,:),PL(4,:),20); ;
hold on; VLplot(VL), VLplot (PL)
Copyright 2012-2025 Tim C. Lueth. All rights reserved. The code is the property of Tim C. Lueth and may not be redistributed or modified without explicit written permission. This software may be used free of charge for academic research and teaching purposes only. Commercial use, redistribution, modification, or reverse engineering is strictly prohibited. Access to source code is restricted and granted only under specific agreements. For licensing inquiries or commercial use, please contact: Tim C. Lueth
Algorithm (Workflow)
This function calculates a 3D Bezier curve using four control points. The function is part of the VLFL-Lib and was introduced in SolidGeometry 1.0.
Input Parameters
- p1: The first control point, a 3D coordinate.
- p2: The second control point, a 3D coordinate.
- p3: The third control point, a 3D coordinate.
- p4: The fourth control point, a 3D coordinate.
- n: (Optional) The number of supporting points for the curve. If not provided, defaults to 4.
Output
- VL: A vertex list representing the Bezier spline.
Algorithm Steps
- Initialize
n to 4. If a fifth argument is provided, set n to that value minus one.
- Create a parameter
t as a linearly spaced vector from 0 to 1 with n+1 points.
- Initialize
VL as a zero matrix with n+1 rows and 3 columns to store the vertex list.
- Calculate the coefficients for the cubic Bezier curve:
c3 = -p1 + 3*(p2-p3) + p4c2 = 3*(p1 - 2*p2 + p3)c1 = 3*(p2 - p1)c0 = p1
- Iterate over each value of
t to compute the Bezier curve points:
- For each
k from 1 to n+1, calculate the point on the curve using the formula:
VL(k,:) = ((c3*t(k) + c2)*t(k) + c1)*t(k) + c0
- If no output is requested, plot the control points and the Bezier curve using
SGfigure and VLplot.
Algorithm explaination created using ChatGPT on 2025-08-19 00:17. (Please note: No guarantee for the correctness of this explanation)
Last html export of this page out of FM database by TL: 2025-09-21