by Tim C. Lueth, SG-Lib Toolbox: SolidGeometry 5.6 - User interface
Introduced first in SolidGeometry 4.9, Creation date: 2020-01-11, Last change: 2025-09-14
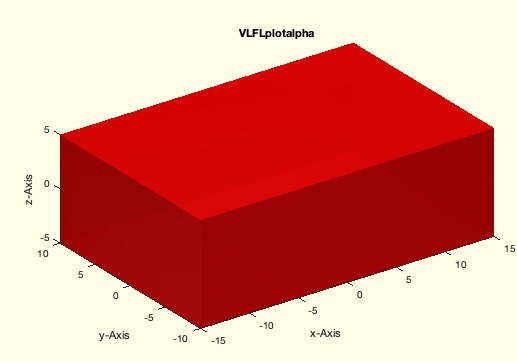
h=VLFLplotalpha(VL,FL,[c,a,e])
VL: | Vertex List | |
FL: | Facet List | |
c: | color; default is []; | |
a: | alpha value; default is []; | |
e: | edge color; default is []; |
h: | handle to graphics object patch |
A=SGbox([30,20,10])
SGfigure; view(-30,30); VLFLplotalpha(A.VL,A.FL,'r',0.9)
SGfigure; view(-30,30); VLFLplotalpha(A.VL,A.FL,'r',0.9,'k')This function, VLFLplotalpha, is designed to plot a 3D solid object using vertex and facet lists, with options for color, transparency, and edge color. It is part of the SolidGeometry library and was developed by Tim Lueth.
FL is empty. If it is, a warning is issued, and the function returns an empty handle.c using getfuncparams with a default of an empty array.a using getfuncparams with a default of 1.e using getfuncparams with a default of an empty array.VLFLplot with VL and FL to create the initial plot and store the handle in h.setplotlight with the handle h, color c, and alpha value a to set the lighting and transparency of the plot.e is not empty, set the edge color of the plot using set(h,'EdgeColor',e).camlightTL to adjust the camera lighting.material metal.The function can be used to plot a box with specified dimensions and view settings:
A=SGbox([30,20,10])
SGfigure; view(-30,30); VLFLplotalpha(A.VL,A.FL,'r',0.9)
SGfigure; view(-30,30); VLFLplotalpha(A.VL,A.FL,'r',0.9,'k')
In this example, a box is created and plotted with a red color and 0.9 transparency. The second plot also specifies a black edge color.
Algorithm explaination created using ChatGPT on 2025-08-19 01:42. (Please note: No guarantee for the correctness of this explanation)