VLFLplotfreeboundary
by Tim C. Lueth, SG-Lib Toolbox: SolidGeometry 5.6 - User interface
Introduced first in SolidGeometry 4.1, Creation date: 2017-08-13, Last change: 2025-09-14
plots the freeboundary of a solid with grid forced vertices (1e-6)
Description
Points that have coordinate differences of less than 1e-6 are mapped to the same vertices in the triangulation class. Therefor the threshold in this function is 1e-6;
See Also: VLFLfreeboundary
, VLFLplots
, VLELplot
, VLFLplot
, VLFLfreeboundaryfacets
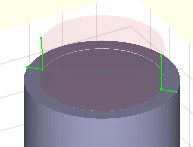
Example Illustration
Syntax
h=VLFLplotfreeboundary(VL,FL,[c,w])
Input Parameter
VL: | | Vertex list |
FL: | | Facet list |
c: | | color; default is 'r-' |
w: | | width of lines |
Output Parameter
h: | | handle to the drawings |
Examples
[A,B]=CSGsample(8); SGbool('A',A,B); X=ans; VLFLplotfreeboundary(X.VL,X.FL);
Copyright 2017-2025 Tim C. Lueth. All rights reserved. The code is the property of Tim C. Lueth and may not be redistributed or modified without explicit written permission. This software may be used free of charge for academic research and teaching purposes only. Commercial use, redistribution, modification, or reverse engineering is strictly prohibited. Access to source code is restricted and granted only under specific agreements. For licensing inquiries or commercial use, please contact: Tim C. Lueth
Algorithm (Workflow)
This function, VLFLplotfreeboundary, is designed to plot the free boundary of a solid with grid-forced vertices. It is part of the SG-Library and was created by Tim Lueth. The function takes in a vertex list (VL), a facet list (FL), and optional parameters for color (c) and line width (w).
Input Parameters
- VL: Vertex list, which contains the coordinates of the vertices.
- FL: Facet list, which contains the indices of vertices that form each facet.
- c: Color of the plot lines. The default value is 'g.-' (green with dots and lines).
- w: Width of the plot lines. The default value is 1.
Output
- h: Handle to the drawings, which can be used for further manipulation or querying of the plot.
Algorithm Steps
- Check if the facet list (FL) is empty. If it is, return an empty handle and exit the function.
- Set default values for color (c) and line width (w). If additional arguments are provided, update these values accordingly.
- Suppress specific MATLAB warnings related to points not being in the triangulation.
- Call the function
VLFLfreeboundary to compute the free boundary edges (EL) from the vertex list (VL) and facet list (FL).
- Re-enable the previously suppressed MATLAB warnings.
- Use the function
VLELplots to plot the edges (EL) with the specified color (c) and line width (w), and return the handle (h) to the plot.
Algorithm explaination created using ChatGPT on 2025-08-19 07:05. (Please note: No guarantee for the correctness of this explanation)
Last html export of this page out of FM database by TL: 2025-09-21