by Tim C. Lueth, SG-Lib Toolbox: SolidGeometry 5.6 - VM/Voxels
Introduced first in SolidGeometry 5.2, Creation date: 2022-05-19, Last change: 2025-09-15
VMplotvoxels(VM,[vs,c,ea])
VM: | Voxel Model | |
vs: | size of voxels; default is [1 1 1] | |
c: | color default is 'k' | |
ea: | edge alpha value; default is 0.5 |
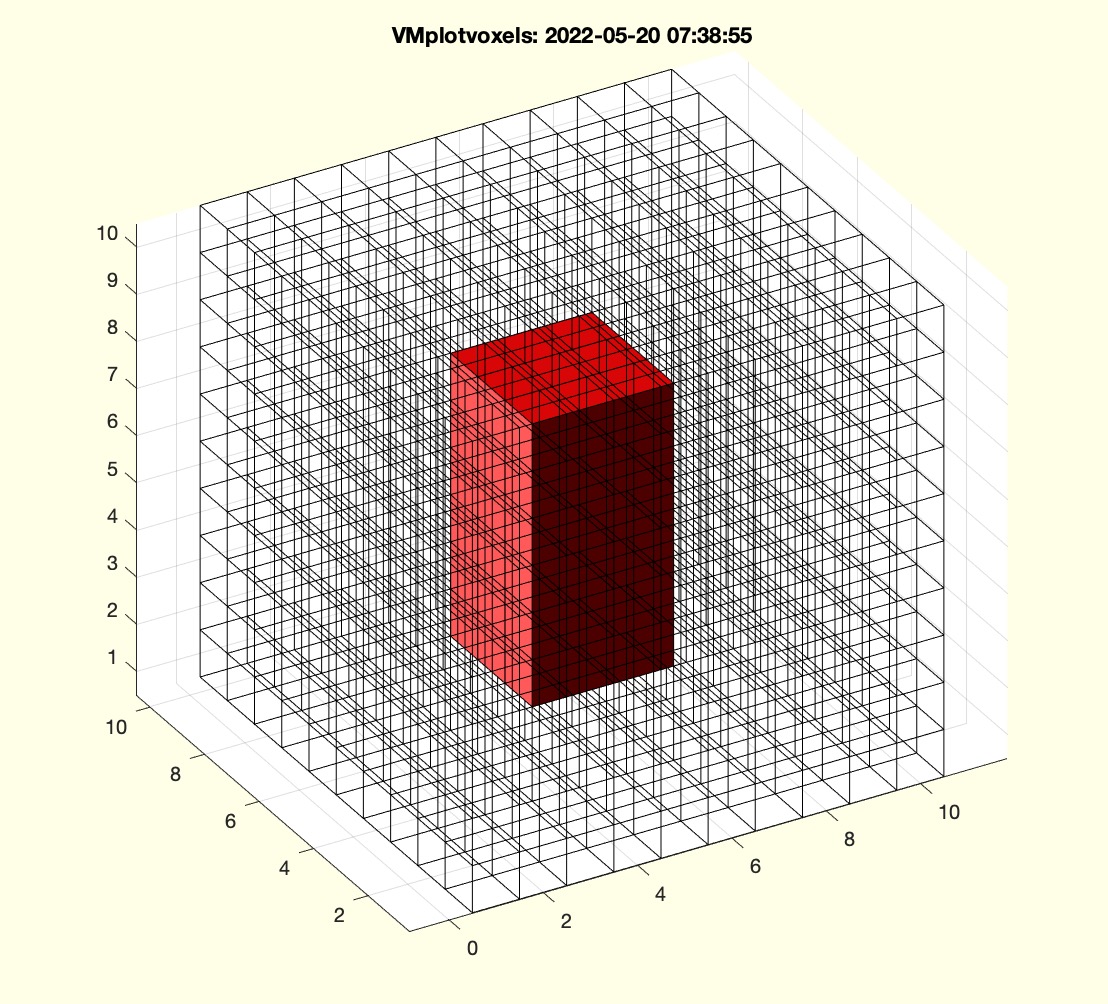
I=zeros(10,10,10); I(4:6,4:6,3:8)=1;
VMplotvoxels(I,[1 1 1],'r',1)


[VM,vs]=VMreaddicomdir('/Volumes/LUETH-WIN/WIN AIM Matlab Libraries/SolidGeometry-Code/AIM_DICOMFILES/');
[VN,ns]=VMresize(VM,[0.1 0.1 0.1],vs);
This function, VMplotvoxels, is designed to plot a voxel model as transparent cubes. It is part of the SolidGeometry library and was introduced in version 5.2. The function does not return a handle to the graphics object for speed reasons.
getfuncparams function. It assigns default values if the parameters are not provided:
vs is set to [1 1 1] if not specified.c is set to 'r' (red) if not specified.ea is set to 0.5 if not specified.VM is determined using the size function, which returns the dimensions of the matrix.VL is created using the VLmeshgrid function. This grid is scaled by the voxel size vs and spans the dimensions of the voxel model VM.SGfigure function, with a specified range of -30 to 30.VM is reshaped into a column vector VML to match the size of the mesh grid VL.VLplotvoxel function is called to plot the voxels. It takes the mesh grid VL, voxel size vs, color c, reshaped voxel model VML, and edge alpha ea as inputs.