by Tim C. Lueth, SG-Lib Toolbox: SolidGeometry 5.6 - VM/Voxels
Introduced first in SolidGeometry 5.2, Creation date: 2022-05-19, Last change: 2025-09-15
VLplotvoxel(VL,[vs,c,a])
VL: | point or list of points | |
vs: | size of voxel; default is [1 1 1] | |
c: | globol color or list of colors of same size as VL | |
a: | globol transparency or list of transparency of same size as VL |
xx=1:1:10; yy=1:1:10; zz=1:1:10;
VL=VLmeshgrid(xx,yy,zz);
SGfigure(-30,30); VLplotvoxel(VL,[1 1 1],'w',0.4);This function, VLplotvoxel, is designed to plot voxels at specified positions. It is part of the SolidGeometry library and was introduced in version 5.2. Below is a detailed explanation of the algorithm and its parameters.
vs, color c, and transparency a from the input parameters or use default values if not provided.VL.a is a scalar, replicate it to match the number of voxels.a using the VMcaxis2 function to ensure they are within a valid range.SGbar function with the specified size vs.VL:
SGtransP.FL matrix.The function can be used as follows:
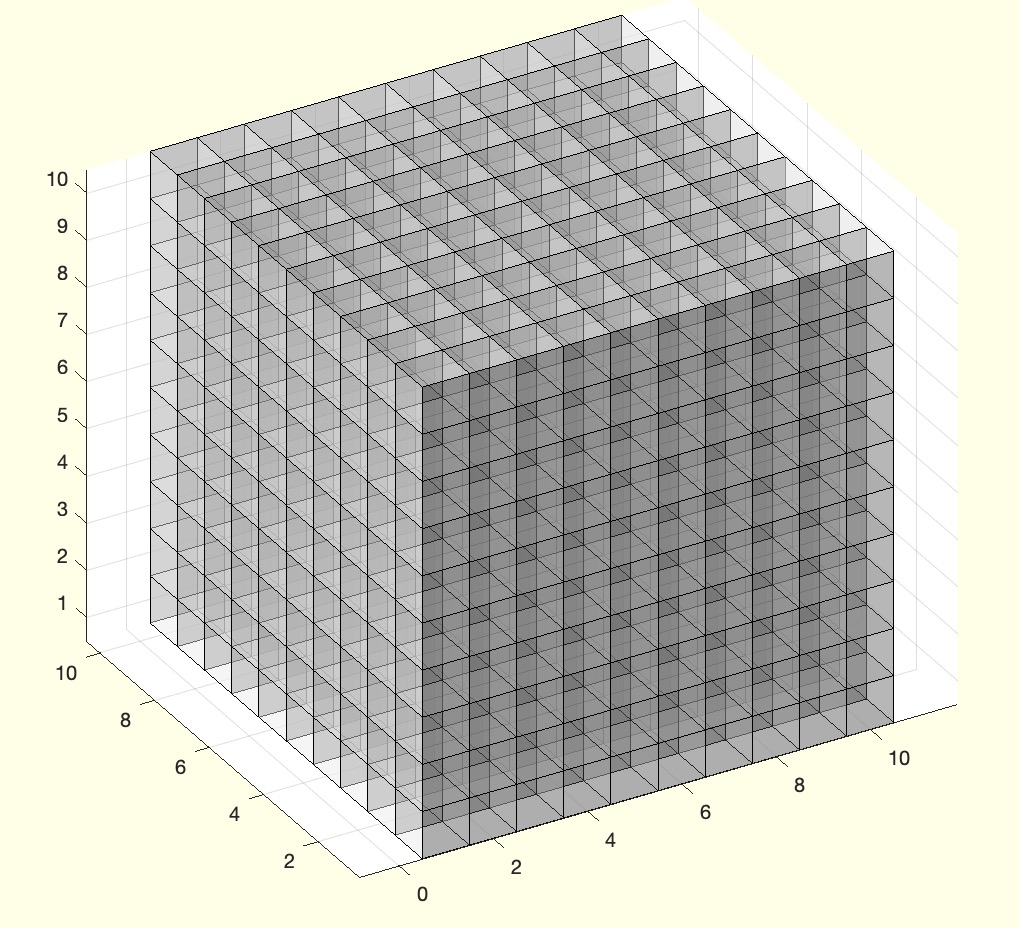
xx = 1:1:10;
yy = 1:1:10;
zz = 1:1:10;
VL = VLmeshgrid(xx, yy, zz);
SGfigure(-30, 30);
VLplotvoxel(VL, [1 1 1], 'w', 0.4);
This example creates a grid of voxels with a size of [1 1 1], white color, and 0.4 transparency.
Algorithm explaination created using ChatGPT on 2025-08-19 07:15. (Please note: No guarantee for the correctness of this explanation)