centerCPL
by Tim C. Lueth, SG-Lib Toolbox: SolidGeometry 5.6 - Geometric Queries
Introduced first in SolidGeometry 3.8, Creation date: 2017-05-14, Last change: 2025-09-14
returns the center of all contours of a CPL
Description
This function helps to find fiducial marker center in xray images
See Also: centerPL
, CPLcontourc
, CPLdisttopoint
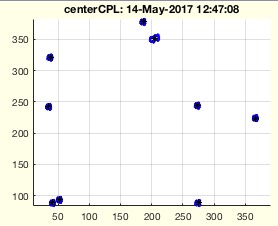
Example Illustration
Syntax
[PL,RL]=centerCPL(CPL)
Input Parameter
CPL: | | Closed Polygon list with several PL's |
Output Parameter
PL: | | List of center of CPL using centerPL |
RL: | | List of distance to most distant point vom PL |
Examples
VL=50*rand(10,3)-25;
I=imageofVLprojection(VL,[100 100],[0 -100 0],[0 100 0],4);
CPL=CPLcontourc(double(I),1);
centerCPL(CPL)
Copyright 2017-2025 Tim C. Lueth. All rights reserved. The code is the property of Tim C. Lueth and may not be redistributed or modified without explicit written permission. This software may be used free of charge for academic research and teaching purposes only. Commercial use, redistribution, modification, or reverse engineering is strictly prohibited. Access to source code is restricted and granted only under specific agreements. For licensing inquiries or commercial use, please contact: Tim C. Lueth
Algorithm (Workflow)
This function, centerCPL, is designed to find the center of all contours in a Closed Polygon List (CPL). It is particularly useful for identifying fiducial marker centers in X-ray images.
Input Parameters
- CPL: A Closed Polygon List containing several polygon lists (PLs).
Output Results
- PL: A list of centers for each polygon in the CPL, calculated using the
centerPL function.
- RL: A list of distances to the most distant point from each polygon's center.
Algorithm Steps
- Use
separateNaN to determine the number of separate polygons (n) in the CPL.
- Initialize
PL as an n-by-2 matrix filled with NaN values to store the centers of each polygon.
- Initialize
RL as an n-by-1 vector filled with NaN values to store the maximum distances.
- Iterate over each polygon (i from 1 to n):
- Extract the i-th polygon using
PLofCPL and separateNaN.
- Calculate the center of the polygon using
centerPL and store it in PL(i,:).
- If the number of output arguments is 0 or more than 1, calculate the maximum distance from the center to any point in the polygon using
vecnormr and store it in RL(i).
- If no output arguments are specified, plot the results:
- Use
SGfigure to create a new figure.
- Plot the CPL using
CPLplot with blue dots and lines.
- Plot the centers using
PLplot with black asterisks.
- For each polygon, plot a circle around the center with radius
RL(i) using CPSplot and PLcircle.
Algorithm explaination created using ChatGPT on 2025-08-19 01:04. (Please note: No guarantee for the correctness of this explanation)
Last html export of this page out of FM database by TL: 2025-09-21