erfinvGauss
by Tim C. Lueth, SG-Lib Toolbox: SolidGeometry 5.6 - Auxiliary function
Introduced first in SolidGeometry 5.0, Creation date: 2021-01-14, Last change: 2025-09-15
returns the inverse error fnct for the Gaussian distribution
Description
Values for x make only sense between 0 and 1
See Also: meanGauss
, erfGauss
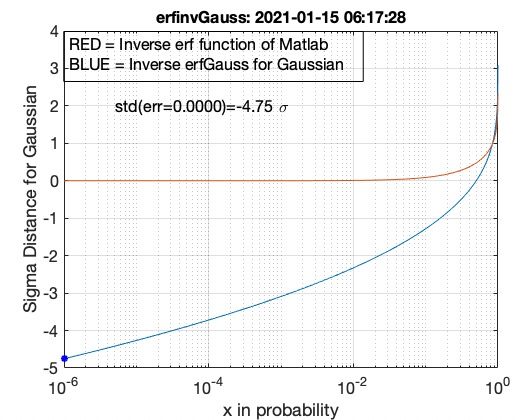
Example Illustration
Syntax
y=erfinvGauss(x)
Input Parameter
Output Parameter
Examples
erfinvGauss(0.01) % sigma for 1 percent
Copyright 2021-2025 Tim C. Lueth. All rights reserved. The code is the property of Tim C. Lueth and may not be redistributed or modified without explicit written permission. This software may be used free of charge for academic research and teaching purposes only. Commercial use, redistribution, modification, or reverse engineering is strictly prohibited. Access to source code is restricted and granted only under specific agreements. For licensing inquiries or commercial use, please contact: Tim C. Lueth
Algorithm (Workflow)
This function, erfinvGauss, calculates the inverse error function for the Gaussian distribution. It is part of the SolidGeometry library and was introduced by Tim Lueth in 2021.
Input Parameters
- x: A probability value, which is the input to the function.
Output Results
- y: The sigma value corresponding to the input probability.
Algorithm Explanation
The function computes the inverse error function for a Gaussian distribution using the following steps:
- Calculate the inverse error function using the formula:
y = sqrt(2) * erfinv(2 * x - 1). This formula transforms the input probability x into a sigma value y.
- Determine the minimum value between
1e-3 and x, storing it in xmin.
- If no output is requested (i.e.,
nargout == 0), the function proceeds to plot the results:
- Create a range
i from xmin to 1 - 1e-3 with steps of xmin.
- Open a new figure using
SGfigure and clear any previous plots with hold off.
- Plot the inverse error function for the Gaussian distribution using a semilogarithmic scale with
semilogx(i, erfinvGauss(i)).
- Plot the standard inverse error function using
semilogx(i, erfinv(i)).
- Enable the grid with
grid on.
- Add labels to the x-axis and y-axis for clarity.
- Annotate the plot to distinguish between the two functions plotted (RED for Matlab's inverse erf function and BLUE for the Gaussian inverse erf function).
- Plot the specific point
(x, y) using PLplot([x y],'b*',2).
- Add a text annotation to the plot with the standard deviation and sigma value using
textP.
- Set the title of the plot with
SGtitle.
Example
To find the sigma value for a 1% probability, use the function call: erfinvGauss(0.01).
Algorithm explaination created using ChatGPT on 2025-08-19 00:21. (Please note: No guarantee for the correctness of this explanation)
Last html export of this page out of FM database by TL: 2025-09-21