getCurrentPoint
by Tim C. Lueth, SG-Lib Toolbox: SolidGeometry 5.6 - SimMechanics
Introduced first in SolidGeometry 3.6, Creation date: 2017-03-21, Last change: 2025-08-26
this fnct returns the currentPoint but also the axis limits
Description
% Sometime after ginput or after get(gca,'CurrentPoint' ) the returned
% coordinates are unfortunately not inside of the active axis. This Matlab bug is
% related to changing programmatically the size of the window by a command and
% having at the time the windowchange allowed.
% This fnctn just help to detect the problem. So it is more a debug fnctn.
See Also:
Example Illustration
Syntax
[p,ax]=getCurrentPoint
Output Parameter
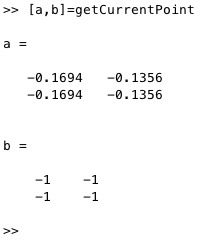
p: | | 2 point describing the view axis of the last click |
ax: | | axis limits for each point -1 to small + 1 to big 0=inside of view |
References
-Ron Pfeifle and Hans-Peter Seidel (1996): GI '96 Proceedings of the conference on Graphics interface '96, Pages 186-193
Copyright 2017-2025 Tim C. Lueth. All rights reserved. The code is the property of Tim C. Lueth and may not be redistributed or modified without explicit written permission. This software may be used free of charge for academic research and teaching purposes only. Commercial use, redistribution, modification, or reverse engineering is strictly prohibited. Access to source code is restricted and granted only under specific agreements. For licensing inquiries or commercial use, please contact: Tim C. Lueth
Algorithm (Workflow)
This function, getCurrentPoint, is designed to address a specific issue in MATLAB where the coordinates returned by ginput or get(gca, 'CurrentPoint') may not be within the active axis due to programmatically changing the window size. It serves as a debugging tool to detect this problem.
Input Parameters
The function does not take any input parameters.
Output Results
- p: A 2x3 or 2x2 matrix describing the view axis of the last click.
- ax: A matrix indicating the axis limits for each point. Values are -1 if the point is too small, +1 if too big, and 0 if inside the view.
Algorithm Steps
- Retrieve the current point using
get(gca, 'CurrentPoint') and store it in p.
- Get the current axis limits using
axis(gca) and replicate it to match the size of p, storing the result in ax.
- Check if the axis has more than four elements (indicating a 3D plot).
- If the axis is 3D:
- Calculate
ax for each dimension (x, y, z) using logical conditions to determine if the point is outside the axis limits.
- If the axis is 2D:
- Calculate
ax for the x and y dimensions only.
- Adjust
p to only include the first two columns.
Algorithm explaination created using ChatGPT on 2025-08-19 01:03. (Please note: No guarantee for the correctness of this explanation)
Last html export of this page out of FM database by TL: 2025-09-21