histograms
by Tim C. Lueth, SG-Lib Toolbox: SolidGeometry 5.6 - Auxiliary function
Introduced first in SolidGeometry 1.1, Creation date: 2014-05-25, Last change: 2025-09-14
calculates histograms for matrices or images or voxel models etc.
Description
This function calculates a histogram distribution of a matrix or of an image using value groups of the same equal size of group values. If parameter n is negative the function tries to find n groups of a equal groups size instead of equal group values.
With Rel 5.1, function supports array in all dimensions
Matlabfunction histcounts was introduced in 2014b which is much faster but has no graphical output
Accelerated using histcounts in REL 5.1
See Also: , VMcaxis2
, VMof2Dprojections
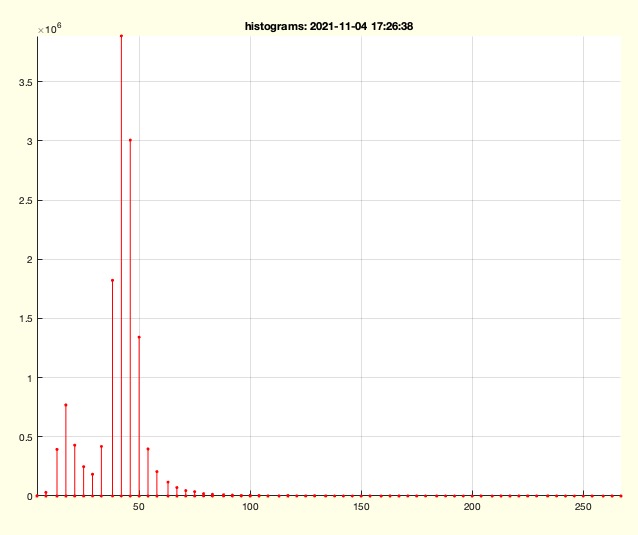
Example Illustration
Syntax
[H,IQ,AE]=histograms(A,[n,e])
Input Parameter
A: | | Image matrix |
n: | | number of equal sized groups; if negative e-true) |
e: | | true = equal group size |
Output Parameter
H: | | Histogram (nx2) Group Value and Group size |
IQ: | | Table of Group Values |
AE: | | Image Matrix with clustered values |
Examples
Try with an image matrix C:
[a,b]=histograms (C,+8); closeall; plot (a,'x-'); whos a
[a,b]=histograms (C,-8); closeall; plot (a,'x-'); whos a
Copyright 2014-2025 Tim C. Lueth. All rights reserved. The code is the property of Tim C. Lueth and may not be redistributed or modified without explicit written permission. This software may be used free of charge for academic research and teaching purposes only. Commercial use, redistribution, modification, or reverse engineering is strictly prohibited. Access to source code is restricted and granted only under specific agreements. For licensing inquiries or commercial use, please contact: Tim C. Lueth
Last html export of this page out of FM database by TL: 2025-09-21