VMcaxis2
by Tim C. Lueth, SG-Lib Toolbox: SolidGeometry 5.6 - VM/Voxels
Introduced first in SolidGeometry 5.1, Creation date: 2021-11-17, Last change: 2025-09-15
adjustes the caxis of the VMplot diagram
Description
In contrast to VMcaxis, which look for minmaxall(VM), this function VMcaxis2 uses the intenstity area to cover 98% of the image histogram intensities
SLOW function
See Also: VMplot
, VMwindowplot
, VMcaxis
, histograms
Example Illustration
Syntax
ca=VMcaxis2(VM,[sect])
Input Parameter
VM: | | [cmin cmax]; default is min and max of the current! surfaces |
sect: | | number of sections for the histogramm; default is 64 |
Output Parameter
ca: | | selected Values if called without input paramter |
Examples
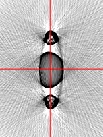
VMplot(VM)
VMcaxis2
Copyright 2021-2025 Tim C. Lueth. All rights reserved. The code is the property of Tim C. Lueth and may not be redistributed or modified without explicit written permission. This software may be used free of charge for academic research and teaching purposes only. Commercial use, redistribution, modification, or reverse engineering is strictly prohibited. Access to source code is restricted and granted only under specific agreements. For licensing inquiries or commercial use, please contact: Tim C. Lueth
Algorithm (Workflow)
This function, VMcaxis2, is designed to adjust the color axis of a VMplot diagram by focusing on the intensity area that covers 98% of the image histogram intensities. It is a part of the SolidGeometry library.
Input Parameters
- VM: This is the input data, typically a matrix representing voxel intensities. The default behavior is to use the minimum and maximum of the current surfaces.
- sect: This optional parameter specifies the number of sections for the histogram. The default value is 64 if not provided.
Output
- ca: This is the output, representing the selected intensity values that cover 98% of the histogram. If the function is called without output arguments, it adjusts the color limits of the current plot.
Algorithm Steps
- Retrieve the number of sections for the histogram using
getfuncparams, defaulting to 64 if not specified.
- Compute the histogram of the VM data using
histcounts with the specified number of sections.
- Convert the histogram data to a format suitable for further processing, ensuring it is of type
uint32.
- Calculate the cumulative distribution of the histogram to find the intensity values that cover 98% of the data.
- Determine the maximum intensity value (
ma) that covers up to 99% of the cumulative distribution.
- Determine the minimum intensity value (
mi) that covers at least 1% of the cumulative distribution.
- Set the output
ca to the range between mi and ma.
- If no output is specified, adjust the color limits of the current plot using the calculated
ca values and apply a grayscale colormap.
Algorithm explaination created using ChatGPT on 2025-08-19 01:06. (Please note: No guarantee for the correctness of this explanation)
Last html export of this page out of FM database by TL: 2025-09-21