by Tim C. Lueth, SG-Lib Toolbox: SolidGeometry 5.6 - Auxiliary function
Introduced first in SolidGeometry 4.9, Creation date: 2020-01-08, Last change: 2025-09-14
h=matrixPLplot(M,PL)
M: | Matrix entries | |
PL: | [r c] or [y x] list |
h: | handle to graphics objects |
matrixdistancefield(M,[20 70;80 50]); M=ans; whos M
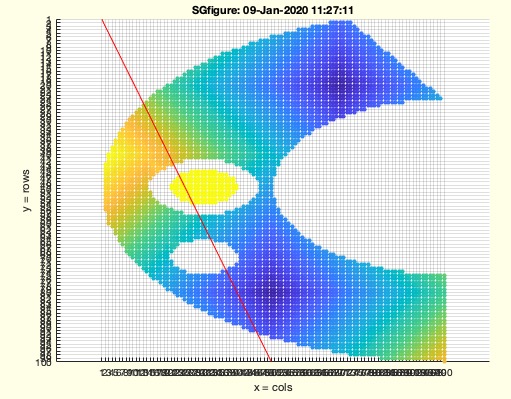
SGfigure; matrixPLplot(M,[1 1; 100 50])
This function, matrixPLplot, is designed to plot a matrix and a point list. It is part of the SG-Library and was created by Tim Lueth. The function is used to visualize the result of path planning.
matrixplot(M), which plots the matrix M. This function is assumed to create a visual representation of the matrix data.h is initialized with the result of matrixplot(M).PLplot is called with the flipped version of PL and the color 'r-' to plot the point list on top of the matrix. The flipping of PL suggests that the input list is transformed from [r c] to [c r] or [y x] to [x y] before plotting.h is updated to include the handle from PLplot, allowing both the matrix and the point list to be manipulated together.The function is straightforward, focusing on plotting a matrix and overlaying a point list. It is useful for visualizing path planning results, where the matrix might represent a grid or map, and the point list represents a path or series of waypoints.
Algorithm explaination created using ChatGPT on 2025-08-18 22:32. (Please note: No guarantee for the correctness of this explanation)