plotannotationtext
by Tim C. Lueth, SG-Lib Toolbox: SolidGeometry 5.6 - Auxiliary function
Introduced first in SolidGeometry 5.4, Creation date: 2024-05-08, Last change: 2025-09-15
create quick an efficient text to be used in combination with plotannotation
Description
annotating figures should be used more efficiently
See Also: plotannotation
, plotannotatecolors
, plotannotationdelete
, plotannotationtopleft
Example Illustration
Syntax
txt=plotannotationtext([NAME,VALU])
Input Parameter
NAME: | | 1st and each second are the names of variables |
VALU: | | 2nd and each second are values of variables |
Output Parameter
Examples
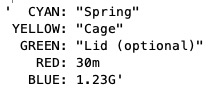
plotannotationtext('CYAN','Spring','YELLOW','Cage','GREEN','Lid (optional)','RED',0.03,'BLUE',1.23e9)
txt=ans;
figure; plotannotation(txt);
Copyright 2024-2025 Tim C. Lueth. All rights reserved. The code is the property of Tim C. Lueth and may not be redistributed or modified without explicit written permission. This software may be used free of charge for academic research and teaching purposes only. Commercial use, redistribution, modification, or reverse engineering is strictly prohibited. Access to source code is restricted and granted only under specific agreements. For licensing inquiries or commercial use, please contact: Tim C. Lueth
Algorithm (Workflow)
This function, plotannotationtext, is designed to create a formatted text string for annotating plots efficiently. It is part of the SolidGeometry library and is used to generate annotations for figures.
Input Parameters
- NAME: The first and every subsequent odd argument are the names of variables.
- VALU: The second and every subsequent even argument are the values of the variables.
Output
- txt: A character array that contains the formatted annotation text.
Algorithm Steps
- Initialize variables
k and ll to zero.
- Determine the maximum length of the variable names by iterating through every odd argument.
- Set the format string
forms to align the variable names and values.
- Check if the number of arguments is even; if not, throw an error.
- Iterate through the arguments in pairs (name and value):
- Increment
k to point to the current name and value.
- Retrieve the name
tt and value ss.
- If
tt is empty, attempt to use the input variable name.
- If
ss is a character array with more than one element, convert it to a string.
- Append the formatted name-value pair to
txt.
- Remove the trailing newline character from
txt.
- If no output is requested, delete existing annotations and create a new annotation with the formatted text.
Example Usage
To use this function, you can call it with pairs of names and values:
plotannotationtext('CYAN','Spring','YELLOW','Cage','GREEN','Lid (optional)','RED',0.03,'BLUE',1.23e9)
This will generate a formatted text string that can be used with the plotannotation function to annotate a figure.
Algorithm explaination created using ChatGPT on 2025-08-19 08:23. (Please note: No guarantee for the correctness of this explanation)
Last html export of this page out of FM database by TL: 2025-09-21