zigzag
by Tim C. Lueth, SG-Lib Toolbox: SolidGeometry 5.6 - Analytical Geometry
Introduced first in SolidGeometry 4.0, Creation date: 2017-07-30, Last change: 2025-09-14
returns a zig zag curve in the interval [0 2*pi]
Description
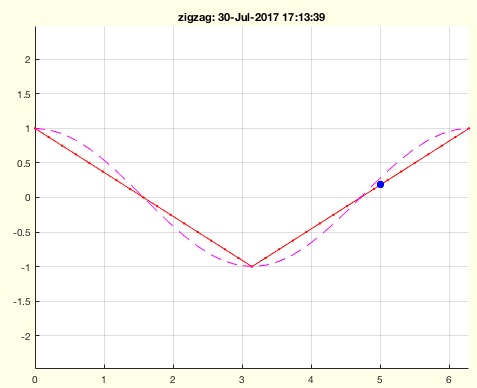
corresponds to cosinus function
See Also:
Example Illustration
Syntax
y=zigzag(x,[per])
Input Parameter
x: | | x value |
per: | | periode; default is 2*pi |
Output Parameter
Examples
zigzag(0)
zigzag(0:2*pi)
zigzag(1,4)
Copyright 2017-2025 Tim C. Lueth. All rights reserved. The code is the property of Tim C. Lueth and may not be redistributed or modified without explicit written permission. This software may be used free of charge for academic research and teaching purposes only. Commercial use, redistribution, modification, or reverse engineering is strictly prohibited. Access to source code is restricted and granted only under specific agreements. For licensing inquiries or commercial use, please contact: Tim C. Lueth
Algorithm (Workflow)
This function, named zigzag, generates a zigzag curve based on the input parameters. It is part of the SolidGeometry library and was introduced in version 4.0. The function is designed to mimic the behavior of a cosine function.
Input Parameters
- x: The x value(s) for which the zigzag function is evaluated. It can be a single value or an array of values.
- per: The period of the zigzag function. The default value is
2*pi. If provided, it adjusts the period of the zigzag pattern.
Output
- y: The calculated zigzag value(s) corresponding to the input x value(s).
Algorithm Steps
- Initialize the default period
per to 2*pi.
- If a second argument is provided and is not empty, set
per to this value and calculate p as per/2.
- Use the modulo operation to wrap the input
x values within the range of the period per.
- Initialize the output
y to be the same as x.
- Iterate over each element in
x:
- If the current
x(i) is greater than p, calculate y(i) as 2*((x(i)-p))/p-1.
- Otherwise, calculate
y(i) as 1-2*(x(i)/p).
- If no output is requested (i.e.,
nargout==0), plot the zigzag function:
- Create a figure using
SGfigure.
- Generate a range of x values
fx from 0 to per with a step of per/32.
- Calculate the corresponding zigzag values
fy and cosine values fz.
- Plot the zigzag curve in red with dots and lines, the input points in blue with stars, and the cosine curve in magenta with dashed lines.
Example Usage
zigzag(0) - Evaluates the zigzag function at x = 0.zigzag(0:2*pi) - Evaluates the zigzag function over the range from 0 to 2*pi.zigzag(1,4) - Evaluates the zigzag function at x = 1 with a period of 4.
Algorithm explaination created using ChatGPT on 2025-08-18 23:33. (Please note: No guarantee for the correctness of this explanation)
Last html export of this page out of FM database by TL: 2025-09-21