CPLplotTL
by Tim C. Lueth, SG-Lib Toolbox: SolidGeometry 5.6 - Kinematics and Frames
Introduced first in SolidGeometry 5.1, Creation date: 2021-03-27, Last change: 2025-09-15
simply plots a contour transferred wrt to list fo frames
See Also: CPLplot
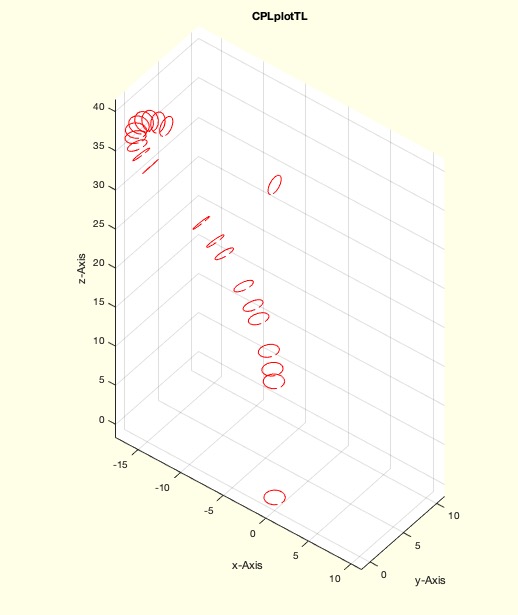
Example Illustration
Syntax
h=CPLplotTL(CPL,TL,[parameter])
Input Parameter
CPL: | | 2D planar contour |
TL: | | List of frames [4x4xn] |
parameter: | | similar to PLplot |
Output Parameter
Examples
TA=eye(4); TB=TofR([0 pi/2 0],[0 0 40]); R=10;
CVLof2T(TA,TB,'',R,'radial'); CVL=ans; whos CVL
TLofCVL(CVL,R,TA,TB); TL=ans;
CPLplotTL(CPL,TL)
Copyright 2021-2025 Tim C. Lueth. All rights reserved. The code is the property of Tim C. Lueth and may not be redistributed or modified without explicit written permission. This software may be used free of charge for academic research and teaching purposes only. Commercial use, redistribution, modification, or reverse engineering is strictly prohibited. Access to source code is restricted and granted only under specific agreements. For licensing inquiries or commercial use, please contact: Tim C. Lueth
Algorithm (Workflow)
This function, CPLplotTL, is designed to plot a 2D planar contour (CPL) that is transformed according to a list of frames (TL). The function is part of the SolidGeometry library and is used for kinematics and frames visualization.
Input Parameters
- CPL: A 2D planar contour represented as a matrix with two columns, each row representing a point in the contour.
- TL: A list of transformation frames, represented as a 4x4xn matrix, where each 4x4 matrix is a transformation matrix for a specific frame.
- parameter: Additional parameters similar to those used in the
PLplot function, passed as a variable argument list (varargin).
Output
- h: A handle to the plot, which can be used for further manipulation or querying of the plot.
Algorithm Steps
- Extract the 'animate' parameter from
varargin using getfuncparamStr, which checks if animation is requested.
- Determine the number of frames
n from the third dimension of TL.
- Ensure
CPL is a 2D matrix by selecting only the first two columns.
- Initialize an empty array
h to store plot handles.
- Iterate over each frame
i from 1 to n:
- Extract the
i-th transformation matrix Ti from TL.
- If
Ti is a 3x3 matrix, convert it to a 4x4 matrix using T3ofT2.
- Transform the contour
CPL by adding a z-coordinate using VLaddz and applying the transformation Ti with VLtransT.
- Plot the transformed contour using
CVLplot and store the plot handle in h.
- If animation is enabled, update the plot immediately using
drawnowvid.
Algorithm explaination created using ChatGPT on 2025-08-19 00:03. (Please note: No guarantee for the correctness of this explanation)
Last html export of this page out of FM database by TL: 2025-09-21